Programming Project 1270707792
i ‘m want make 10 min cartoon animation like this
Freelance Projects, Design and Programming Tutorials
Fun with Canvas: Create a Bar Graphing Plugin, Part 2
In this two-part series, we’ll combine the versatile canvas element with the robust jQuery library to create a bar graphing plugin. In this second part, we are going to convert it in to a jQuery plugin, and then add some eye candy and additional features.
Concluding the Fun with canvas two-part series, today we are going to create a bar graphing plugin; not an ordinary plug in, mind you. We are going to show some jQuery love to the canvas element to create a very robust plugin.
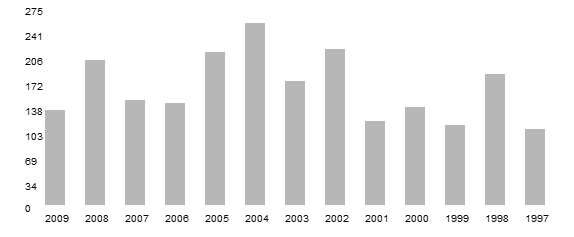
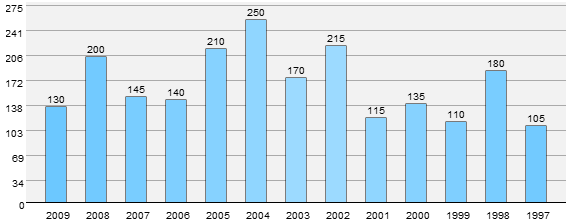
In part one, we looked solely at implementing the logic of the plug in as a standalone script. At the end of part one, our bar graph looked like so.
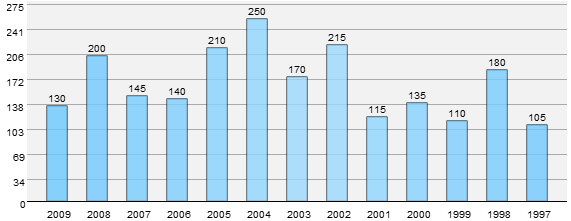
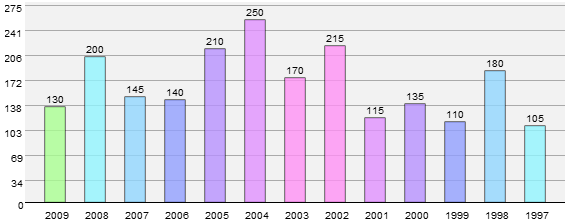
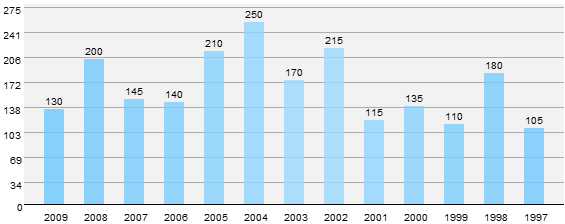
In this final part, we’ll work on converting our code and making it a proper jQuery plugin, adding some visual niceties and finally including some additional features. Ultimately, our output will look like so:
All warmed up? Lets dive in!
Before we start converting our code into a plugin we first need to look at a few formalities when it comes to plugin authoring.
We begin by choosing a name for the plugin. I’ve chosen barGraph and renamed the JavaScript file to jquery.barGraph.js. We now enclose all the code from the previous article inside the following snippet.
$.fn.barGraph = function(settings) {
//code here
}
Settings contains all of the optional parameters passed to the plugin.
In jQuery plugin authoring, it is generally considering a best practice to use jQuery instead of the $ alias in your code, in order to minimize conflicts with other Javascript libraries. Instead of going through all that trouble, we can just use custom aliases as mentioned in the jQuery docs. We enclose all our plugin code within this self executing anonymous function, as shown below:
(function($) {
$.fn.barGraph = function(settings) {
//plugin implementation code here
}
})(jQuery);
Essentially, we encapsulate all our code within a function and pass jQuery to it. We are free to use the $ alias as much as we want inside our code now, without having to worry about it potentially conflicting with other JavaScript libraries.
When designing a plugin, it is good sense to expose a reasonable number of settings to the user, whilst using sensible default options if the users uses the plugin without passing any options to it. With that in mind, we are going to enable the user to change each of the graph option variables I mentioned in this previous article in this series. Doing so is easy; we just define each of these variables as properties of an object and then access them.
var defaults = {
	         barSpacing = 20,
	 		 barWidth = 20,
	    	 cvHeight = 220,
			 numYlabels = 8,
			 xOffset = 20,
			 maxVal,
			 gWidth=550,
			 gHeight=200;
           };
We finally need to merge the default options with the passed options, giving preference to the passed ones. This line takes care of that.
var option = $.extend(defaults, settings);
Do remember to change the variables names wherever necessary. As in –
return (param*barWidth)+((param+1)*barSpacing)+xOffset;
…changes to:
return (param*option.barWidth)+((param+1)*option.barSpacing)+option.xOffset;
This is where the plugin is hammered out. Our old implementation could only produce a single graph in a page, and the ability to create multiple graphs in a page is the main reason we are creating a plugin for this functionality. Plus, we need to make sure that the user doesn’t need to create a canvas element for every graph to be created. With that in mind, we are going to create the canvas elements dynamically as needed. Let’s proceed. We’ll look at the earlier and updated versions of the relevant portions of the code.
Before we start, I’d like to point out how our plugin will be invoked.
$("#years").barGraph
   ({
		 barSpacing = 30,
        barWidth = 25,
		 numYlabels = 12,
   });
Simple as that. years is the ID of the table holding all our values. We pass in the options as needed.
To start things off, we first need a reference to the source of data for the graphs. We now access the source element and obtain its ID. Add the following line to the bunch of graph variables we declared earlier.
var dataSource = $(this).attr("id");
We define a new variable and assign it the value of the passed element’s ID attribute. Within our code, this refers to the currently selected DOM element. In our example, it refers to the table with an ID of years.
In the previous implementation, the ID for the data source was hard coded in. Now we replace that with the ID attribute we extracted earlier. The earlier version of the grabValues function is below:
function grabValues ()
	 {
	 	// Access the required table cell, extract and add its value to the values array.
		 $("#data tr td:nth-child(2)").each(function(){
		 gValues.push($(this).text());
	 	 });

		 // Access the required table cell, extract and add its value to the xLabels array.
		 $("#data tr td:nth-child(1)").each(function(){
	 	xLabels.push($(this).text());
	 	 });
	 }
It is updated to this:
function grabValues ()
	 {
     	// Access the required table cell, extract and add its value to the values array.
	 	$("#"+dataSource+" tr td:nth-child(2)").each(function(){
		 gValues.push($(this).text());
	 	 });

		 // Access the required table cell, extract and add its value to the xLabels array.
		 $("#"+dataSource+" tr td:nth-child(1)").each(function(){
	 	xLabels.push($(this).text());
	 	 });
	 }
function initCanvas ()
	 {
		 $("#"+dataSource).after("<canvas id=\"bargraph-"+dataSource+"\" class=\"barGraph\"> </canvas>");

         // Try to access the canvas element
     	cv = $("#bargraph-"+dataSource).get(0);

	 	if (!cv.getContext)
	 	{ return; }

     	// Try to get a 2D context for the canvas and throw an error if unable to
     	ctx = cv.getContext('2d');
	 	if (!ctx)
	 	{ return; }
	 }
We create a canvas element and inject it into the DOM after the table, which acts as the data source. jQuery’s after function comes in really handy here. A class attribute of barGraph and an ID attribute in the format barGraph-dataSourceID is also applied to enable the user to style them all as a group or individually as needed.
There are two ways you could invoke this plugin actually. You could either create each graph separately passing in only one data source or you could pass in a number of sources. In the latter case, our current construct will encounter an error and quit. To rectify this, we use the each construct to iterate over the set of passed elements.
(function($){
	$.fn.barGraph = function(settings) {

	// Option variables
	var defaults = {
	         // options here
           };

	// Merge the passed parameters with the defaults
    var option = $.extend(defaults, settings);

	// Cycle through each passed object
	this.each(function() {

	// Implementation code here
	});

	// Returns the jQuery object to allow for chainability.
	return this;
	}
})(jQuery);
We encapsulate all code after obtaining and merging the settings inside the this.each construct. We also make sure to return the jQuery object at the end to enable chainability.
With this, our refactoring is complete. We should be able to invoke our plugin and create as many graphs as needed.
Now that our conversion is complete, we can work on making it visually better. We are going to do a number of things here. We’ll look at each of them separately.
The older version used a bland gray to draw the graphs. We are going to implement a theming mechanism for the bars now. This, by itself, consists of a series of steps.
var defaults = {
             // Other defaults here
	 	 	 theme: "Ocean",
           };
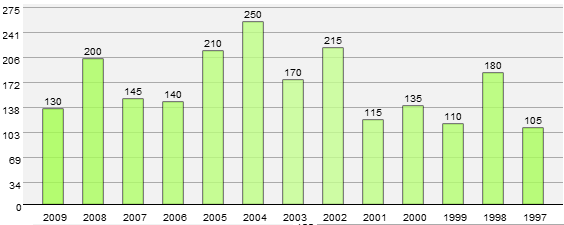
We add a theme option to the defaults enabling the user to change the theme to any of the four presets available.
function grabValues ()
{
// Previous code
switch(option.theme)
{
case 'Ocean':
gTheme = thBlue;
break;
case 'Foliage':
gTheme = thGreen;
break;
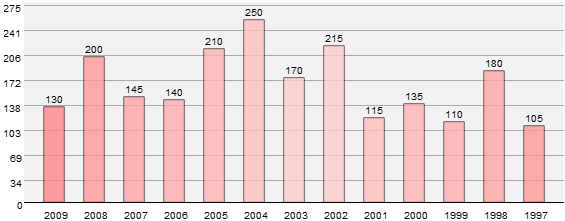
case 'Cherry Blossom':
gTheme = thPink;
break;
case 'Spectrum':
gTheme = thAssorted;
break;
}
}
A simple switch construct looks at the option.theme setting and points the gTheme variable to the necessary colours array. We use descriptive names for the themes instead of generic ones.
// Themes
	var thPink = ['#FFCCCC','#FFCCCC','#FFC0C0','#FFB5B5','#FFADAD','#FFA4A4','#FF9A9A','#FF8989','#FF6D6D'];
	var thBlue = ['#ACE0FF','#9CDAFF','#90D6FF','#86D2FF','#7FCFFF','#79CDFF','#72CAFF','#6CC8FF','#57C0FF'];
	var thGreen = ['#D1FFA6','#C6FF91','#C0FF86','#BCFF7D','#B6FF72','#B2FF6B','#AAFE5D','#A5FF51','#9FFF46'];
	var thAssorted = ['#FF93C2','#FF93F6','#E193FF','#B893FF','#93A0FF','#93D7FF','#93F6FF','#ABFF93','#FF9B93'];
We then define a number of arrays, each holding a series of shades of a specific colours. They start off with the lighter hue and keep on increasing. We’ll loop through these arrays later. Adding themes is as simple as adding an array for the specific colour you need, and then modifying the earlier switch to reflect the changes.
function getColour (param)
      {
         return Math.ceil(Math.abs(((gValues.length/2) -param)));
	  }
This is a tiny function which lets us achieve and apply a gradient like effect to the graphs. Essentially, we compute the absolute difference between half of the number of values to be rendered and the passed parameter, which is the index of the currently selected item in the array. This way, we are able to create a smooth gradient. Since we’ve only defined nine colours in each of the colours array, we are limited to eighteen values a graph. Extending this number should be fairly trivial.
function drawGraph ()
	 {
	    for(index=0; index<gValues.length; index++)
	      {
		    ctx.save();
			ctx.fillStyle = gTheme[getColour(index)];
	        ctx.fillRect( x(index), y(gValues[index]), width(), height(gValues[index]));
		    ctx.restore();
	      }
	 }
This is where we actually theme the graphs. Instead of setting a static value to the fillStyle property, we use the getColour function to retrieve the necessary index of the element in the currently selected theme’s array.
Next up, we are going to give the user the ability to control the opacity of the bars drawn. Settings this is a two-step process.
var defaults = {
            // Other defaults here
	 	 	 barOpacity : 0.8,
           };
We add a barOpacity option to the defaults, enabling the user to change the opacity of the graphs to a value from 0 to 1, where 0 is completely transparent, and 1 is completely opaque.
function drawGraph ()
	 {
	    for(index=0; index<gValues.length; index++)
	      {
		    ctx.save();
			ctx.fillStyle = gTheme[getColour(index)];
            ctx.globalAlpha = option.barOpacity;
	        ctx.fillRect( x(index), y(gValues[index]), width(), height(gValues[index]));
		    ctx.restore();
	      }
	 }
The globalAlpha property controls the opacity or transparency of the rendered element. We set this property’s value to the passed value or the default value to add a bit of transparency. As a sensible default, we use a value of 0.8 to make it just a tiny bit transparent.
A grid can be extremely useful in processing the data presented in a graph. Though I initially wanted a proper grid, I later settled for a series of horizontal lines lining up with the Y axis labels and completely threw away the vertical lines, since they just got in the way of the data. With that out of way, let’s go implement a way to render it.
Creating the lines using paths and the lineTo method seemed to be the most obvious solution for drawing the graphs, but I happened to run into a rendering bug which made this approach unsuitable. Hence I am sticking with the fillRect method to create these lines too. Here is the function in its entirety.
function drawGrid ()
      {
		  for(index=0; index<option.numYlabels; index++)
	      {
		   ctx.fillStyle = "#AAA";
		   ctx.fillRect( option.xOffset, y(yLabels[index])+3, gWidth, 1);
		  }
      }
This is very similar to drawing the Y axis labels, except that instead of rendering a label, we draw a horizontal line spanning the width of graph with a width of 1 px. The y function helps us in the positioning.
var defaults = {
             // Other defaults here
	 	 	 disableGrid : false,
           };
We add a disableGrid option to the defaults, enabling the user to control whether a grid is rendered or not. By default, it is rendered.
    // Function calls
    	if(!option.disableGrid) { drawGrid(); }
We just check whether the user wants the grid to be rendered and proceed accordingly.
Now that the bars all are coloured, it lacks accent against a lighter background. To rectify this, we need a 1px stroke. There are two ways to do this. The first, and easiest, way would be to just add a strokeRect method to the drawGraph method; or, we could use the lineTo method to quickly stroke the rectangles. I chose the former route since as before the lineTo method threw some weird rendering bug at me.
First we add it to the defaults object to give the user control of whether this is applied or not.
var defaults = {
             // Other defaults here
	 	 	 showOutline : true,
           };
function drawGraph ()
	 {
	       // Previous code
			if (option.showOutline)
			{
			ctx.fillStyle = "#000";
			ctx.strokeRect( x(index), y(gValues[index]), width(), height(gValues[index]));
			}
			// Rest of the code
	      }
	 }
We check whether the user wants to render the outlines, and, if yes, we proceed. This is almost the same as rendering the actual bars except that instead of using the fillRect method we use the strokeRect method.
In the original implementation, there is no differentiation between the canvas element itself, and the actual rendering space of the bars. We’ll rectify this now.
function shadeGraphArea ()
      {
	    ctx.fillStyle = "#F2F2F2";
	    ctx.fillRect(option.xOffset, 0, gWidth-option.xOffset, gHeight);
      }
This is a tiny function which shades the required area. We cover the canvas element minus the area covered by the labels of both axes. The first two parameters point to the x and y coordinates of the starting point, and the last two point to the required width and height. By starting at option.offset, we eliminate the area covered by the Y axis labels, and by limiting the height to gHeight, we eliminate the X axis labels.
Now that our graph looks pretty enough, we can concentrate on adding some new features to our plugin. We’ll look at each separately.
Consider this graph of the famous 8K peaks.
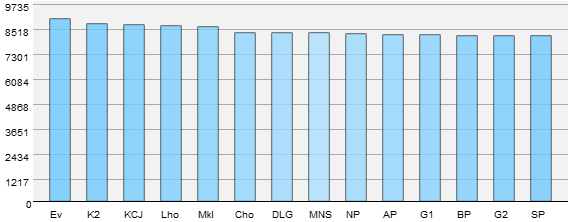
When the highest value is sufficiently high enough, and most of the values fall within 10% of the maximum value, the graph ceases to be useful. We have two ways to rectify this.
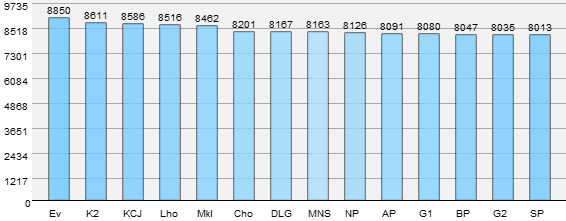
We are going to start with the easier solution first. By rendering the value of the respective graphs at the top, the problem is virtually solved since the individual values can be easily differentiated. Here is how it is implemented.
var defaults = {
             // Other defaults here
	 	 	 showValue: true,
           };
First we add an entry to the defaults object to enable the user to switch it on and off at will.
    // Function calls
	if(option.showValue) { drawValue(); }
We check whether the user wants the value to be shown and proceed accordingly.
function drawValue ()
      {
		  for(index=0; index<gValues.length; index++)
	      {
		      ctx.save();
			  ctx.fillStyle= "#000";
			  ctx.font = "10px 'arial'";
			  var valAsString = gValues[index].toString();
		      var valX = (option.barWidth/2)-(valAsString.length*3);
		      ctx.fillText(gValues[index], x(index)+valX,  y(gValues[index])-4);
			  ctx.restore();
		  }
      }
We iterate through the gValues array and render each value individually. The computations involving valAsString and valX are nothing but tiny calculations to aid us in the correct indentations, so it doesn’t look out of place.

This the harder of the two solutions. In this method, instead of starting the Y axis labels at 0, we start a lot closer to the minimum value. I’ll explain as we go. Do note that, in the above example, the difference between subsequent values with respect to the maximum value is pretty insignificant and doesn’t show its effectiveness as much. Other data sets should give easier to parse results.
var defaults = {
             // Other defaults here
	 	 	 scale: false
           };
Since the scale function is an integral part of the rendering process, we need to update it to allow the scaling feature. We update it like so:
function scale (param)
      {
	   return ((option.scale) ? Math.round(((param-minVal)/(maxVal-minVal))*gHeight) : Math.round((param/maxVal)*gHeight));
      }
I know this looks a little complicated, but it looks that way only due to use of the ternary conditional operator. Essentially, we check the value of option.scale and if it says false, the older code is executed. If it is true, instead of normalizing the value as a function of the maximum value in the array, we now normalize it to be a function of the difference between the maximum and minimum values. Which brings us to:
We now need to find out both the maximum and minimum value, as opposed to only the maximum we had to before. The function is updated to this:
function minmaxValues (arr)
     {
		maxVal=0;

	    for(i=0; i<arr.length; i++)
	    {
		 if (maxVal<parseInt(arr[i]))
		 {
		 maxVal=parseInt(arr[i]);
	     }
	    }
		minVal=maxVal;
		for(i=0; i<arr.length; i++)
	    {
		 if (minVal>parseInt(arr[i]))
		 {
		 minVal=parseInt(arr[i]);
	     }
		}
	   maxVal*= 1.1;
       minVal = minVal - Math.round((maxVal/10));
	 }
I am sure you could accomplish the same in a single loop without using as many lines of code as me, but I was feeling particularly uncreative at that time so bear with me. With the calculation formalities out of the way, we issue a 5% increase to the maxVal variable and to the minVal variable, we subtract a value equal to 5% of maxVal’s value. This is to ensure the bars don’t touch the top everytime and the differences between each Y axis labels is uniform.
With all the groundwork done, we now proceed to update the Y axis label rendering routine to reflect the scaling.
function drawYlabels()
      {
		 ctx.save();
	     for(index=0; index<option.numYlabels; index++)
	      {
			  if (!option.scale)
			  {
		  		 yLabels.push(Math.round(maxVal/option.numYlabels*(index+1)));
			  }
			  else
			  {
				  var val= minVal+Math.ceil(((maxVal-minVal)/option.numYlabels)*(index+1));
		  		  yLabels.push(Math.ceil(val));
			  }
		   ctx.fillStyle = option.labelColour;
		   var valAsString = yLabels[index].toString();
		   var lblX = option.xOffset - (valAsString.length*7);
		   ctx.fillText(yLabels[index], lblX, y(yLabels[index])+10);
	      }
		   if (!option.scale)
		   {
	        	ctx.fillText("0", option.xOffset -7, gHeight+7);
		   }
		  else
		  {
		    var valAsString = minVal.toString();
		    var lblX = option.xOffset - (valAsString.length*7);
		    ctx.fillText(minVal, lblX, gHeight+7);
		  }
		  ctx.restore();
      }
Pretty meaty update if you ask me! The core of the function remains the same. We just check whether the user has enabled scaling and branch off the code as needed. If enabled, we alter the way the Y labels are assigned to make sure they adhere to the new algorithm. Instead of the maximum value divided into n number of evenly spaced numbers, we now compute the difference between the maximum and minimum value, divide it into uniformly spaced numbers, and add it to the minimum value to build our array of Y axis labels. After this, we proceed as normal, rendering each label individually. Since we rendered the bottom-most 0 manually, we have to check whether scaling is enabled and then render the minimum value in its place. Don’t mind the small numerical additions to each passed parameter; it is just to make sure each element of the graph lines up as expected.
In our previous implementation, we hard coded the dimensions of the graph, which presents significant difficulty when the number of values change. We are going to rectify this now.
var defaults = {
            // Other defaults here
	 	 	 cvHeight: 250, //In px
           };
We let the user set the height of the canvas element alone. All other values are calculated dynamically and applied as needed.
The initCanvas function handles all the canvas initialization, and, hence, needs to be updated to implement the new functionality.
function initCanvas ()
	 {
		 $("#"+dataSource).after("<canvas id=\"bargraph-"+dataSource+"\" class=\"barGraph\"> </canvas>");

	 	// Try to access the canvas element
     	cv = $("#bargraph-"+dataSource).get(0);
	 	cv.width=gValues.length*(option.barSpacing+option.barWidth)+option.xOffset+option.barSpacing;
		cv.height=option.cvHeight;
		gWidth=cv.width;
		gHeight=option.cvHeight-20;

	 	if (!cv.getContext)
	 	{ return; }

     	// Try to get a 2D context for the canvas and throw an error if unable to
     	ctx = cv.getContext('2d');
	 	if (!ctx)
	 	{ return; }
	 }
After injecting the canvas element, we obtain a reference to the created element. The canvas element’s width is calculated as a function of the number of elements in the array – gValues , the space between each bar – option.barSpacing, the width of each bar itself – option.barWidth and finally option.xOffset. The graph’s width changes dynamically based on each of these parameters. The height is user modifiable and defaults to 220px with the rendering area for the bar’s itself being 220px. The 20px is allocated to the X axis labels.
It makes sense that the user might want to hide the source table once the graph has been created . With this in mind, we let the user decide whether to remove the table or not.
var defaults = {
            // Other defaults here
			 hideDataSource: true,
           };
if (option.hideDataSource) { $("#"+dataSource).remove();}
We check whether the user wants to hide the table and if yes, we remove it completely form the DOM using jQuery’s remove method.
Now that all the hard work has been done, we can review how to optimize our code. Since this code has been written entirely for teaching purposes, most of the work has been encapsulated as separate functions and moreover they are a lot more verbose than they need to be.
If you really want the leanest code possible, our entire plugin, excluding the initialization and computation, can be rewritten within two loops. One looping through the gValues array to draw the bars themselves and the X axis labels; and the second loop iterating from 0 to numYlabels to render the grid and the Y axis labels. The code would look a lot messier, however, it should lead to a significantly smaller code base.
That’s it folks! We’ve created a high level plugin completely from scratch. We looked at a number of topics in this series including:
I hope you’ve had as much fun reading this as I had writing it. This being a 270-odd line work, I am sure I left out something. Feel free to hit the comments and ask me. Or criticize me. Or praise me. You know, it’s your call! Happy coding!
Fun With Canvas: Create a Bar Graphing Plugin, Part 1
In this two-part series, we’ll combine the versatile canvas element with the robust jQuery library to create a bar graphing plugin. In this first part, we are going to code the core logic of the plugin as a standalone version.
Today, we are going to create a bar graphing plugin. Not an ordinary plugin, mind you. We’ll show some jQuery love to the canvas element to create a very robust plugin.
In this two-part article, we will start from the beginning by implementing the logic of the plugin as a standalone script, refactoring it into a plugin and then finally adding all the additional eye candy on top of the plugin code. In this first part, we are going to deal solely with implementing the core logic.
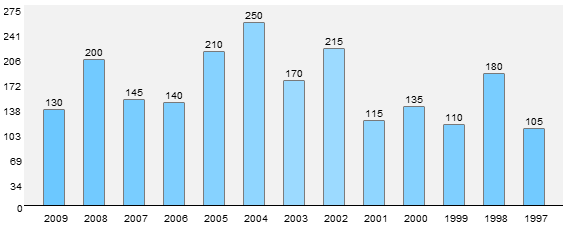
Need an example before we get started? Here you go!

Satisfied? Interested yet? Let’s start.
Our plugin needs to accomplish some basic things whilst not doing some other things. Let me elucidate:
As we are delving into the world of cutting-edge, still not fully specified, technology, we do have some dependencies. For the canvas element to work, most modern browsers are sufficient. But since we make use of the new text rendering API, we need newer builds. Browsers utilizing the Webkit engine r433xx and above or the Gecko engine 1.9.1 and above should be excellent platforms for the plugin. I recommend grabbing a nightly build of Chromium or Firefox.
I’d like to mention that our plugin is purely for learning purposes. This plugin is in no way meant to replace other full-fledged graphing plugins like Flot, Plotr and such. Also the code is going to be as verbose as possible. You could write far, far more efficient code but for the sake of learning, everything is going to be as uncomplicated as possible. Feel free to refactor it in favor of efficiency in your production code.
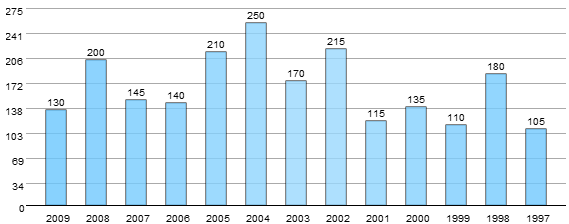
<!DOCTYPE html>
<html lang="en-GB">
<head>
<title>OMG WTF HAX</title>
</head>

<body>

<table width="200" border="0" id="data">

 <tr>
	<th>Year</th>
	<th>Sales</th>
 </tr>

 <tr>
	<td>2009</td>
	<td>130</td>
 </tr>

 <tr>
	<td>2008</td>
	<td>200</td>
 </tr>

 <tr>
	<td>2007</td>
	<td>145</td>
 </tr>

 <tr>
	<td>2006</td>
	<td>140</td>
 </tr>

 <tr>
	<td>2005</td>
	<td>210</td>
 </tr>

 <tr>
	<td>2004</td>
	<td>250</td>
 </tr>

 <tr>
	<td>2003</td>
	<td>170</td>
 </tr>

 <tr>
	<td>2002</td>
	<td>215</td>
 </tr>

 <tr>
	<td>2001</td>
	<td>115</td>
 </tr>

 <tr>
	<td>2000</td>
	<td>135</td>
 </tr>
 <tr>
	<td>1999</td>
	<td>110</td>
 </tr>

 <tr>
	<td>1998</td>
	<td>180</td>
 </tr>

 <tr>
	<td>1997</td>
	<td>105</td>
 </tr>

</table>

<canvas id="graph" width="550" height="220"></canvas>

<script type="text/javascript" src="jquery.js"></script>
<script type="text/javascript" src="mocha.js"></script>

</body>
</html>
Nothing special about the markup. I’ll do a quick overview anyway.
Before we start the Javascript, let me explain the canvas coordinate system. The top-left corner acts as the origin i.e. (0, 0). Points are then measured with respect to the origin with x increasing along the right and y increasing along the left. For the mathematically inclined, we are effectively working in the 4th quadrant except that we take the absolute value of y instead of its negative value. If you have worked with graphics in other languages you should be at home here.

Canvas’ rectangle rendering routine will be used extensively through out the article to render the bars, the grid and some other elements. With that in mind, let’s take a short look at those routines.
Of the three routines available, we will be using the fillRect and strokeRect methods. The fillRect method actually fills the rendered rectangle while the strokeRect method only strokes the rectangles. Other than that, both the methods take the same parameters.

As always, I highly recommend you to download the source code and have it on the side for reference. It’s easier to look at the big picture and parse each function one by one than look at each function individually and then create the big picture in your mind.
	var
		barSpacing = 20,
	 	barWidth = 20,
	    cvHeight = 220,
		numYlabels = 8,
		xOffset = 20,
		gWidth=550,
		gHeight=200;

	var maxVal,
    	gValues = [],
	    xLabels = [],
		yLabels = [];

    var cv, ctx;
These variables hold hard coded values to aid us in positioning and layout of the graph and the individual bars.

With jQuery’s strong selector engine it becomes very easy for us to get the data we need. Here we have a number of ways to access the necessary elements. Let me explain a few below:
$("tr").children("td:odd").each(function(){
//code here
});
The simplest way to access the necessary rows. Looks for a tr element and then accesses every other td element. Fails miserably when you have more than one table on your page.
$("#data").find("td:odd").each(function(){
//code here
});
A much more straight forward way. We pass in the ID of the table and then access every other row.
$("#data tr td:odd").each(function(){
//code here
});
Same as above except that we just use CSS style selector syntax.
$("#data tr td:nth-child(2)").each(function(){
//code here
});
The version we are going to use today. This way is a lot better if we need to grab data from a different row or, if needed, multiple rows.
The final version looks like so:
function grabValues ()
	 {
	 	// Access the required table cell, extract and add its value to the values array.
		 $("#data tr td:nth-child(2)").each(function(){
		 gValues.push($(this).text());
	 	 });

		 // Access the required table cell, extract and add its value to the xLabels array.
		 $("#data tr td:nth-child(1)").each(function(){
	 	xLabels.push($(this).text());
	 	 });
	 }
Nothing complicated here. We use the snippet of code mentioned above to add the value of the table cell to the gValues array. Next, we do the same except that we access the first table cell in order to extract the requisite label for the x axis. We’ve encapsulated the data extraction logic to its own function for code reusability and readability.
function initCanvas ()
	 {
	 	// Try to access the canvas element and throw an error if it isn't available
     	cv = $("#graph").get(0);
	 	if (!cv)
	 	{ return; }

     	// Try to get a 2D context for the canvas and throw an error if unable to
     	ctx = cv.getContext('2d');
	 	if (!ctx)
	 	{ return; }
	 }
Routine canvas initialization. First we try to access the canvas element itself. We throw an error if unable to. Next up, we try to obtain a reference to the 2d rendering context through the getContext method and throw an error if we’re unable to do so.
Before we step into the actual rendering of the graph itself, we need to look at a number of utility functions which aid us greatly in the process. Each of them are tiny by themselves, but will be used extensively throughout our code.
function maxValues (arr)
     {
		maxVal=0;

	    for(i=0; i<arr.length; i++)
	    {
		 if (maxVal<parseInt(arr[i]))
		 {
		 maxVal=parseInt(arr[i]);
	     }
	    }

	   maxVal*= 1.1;
	 }
A small function which iterates through the passed array and updates the maxVal variable. Do note that we inflate the maximum value by 10% for special purposes. If the maximum value is left as it is, then the bar representing the topmost value will touch the edge of the canvas element which we do not want. With that in mind, a 10% increment is issued.
function scale (param)
      {
	   return  Math.round((param/maxVal)*gHeight);
      }
A small function to normalize the extracted value with respect to the height of the canvas element. This function is used extensively in other functions and directly in our code to express the value as a function of the height of the canvas. Takes a single parameter.
function x (param)
      {
	   return (param*barWidth)+((param+1)*barSpacing)+xOffset;
      }
Returns the x ordinate to the fillRect to aid us in the positioning of each individual bar. I’ll explain this a bit more in detail when it is used.
function y (param)
      {
	   return gHeight - scale (param) ;
      }
Returns the y ordinate to the fillRect method to aid us in the positioning of each individual bar. More explanations a bit later.
function width ()
      {
	   return barWidth;
      }
Returns the width of each individual bar.
function height (param)
      {
	   return scale(param);
      }
Returns the height of the bar to be drawn. Uses the scale function to normalize the value and then returns it to the caller.
function drawXlabels ()
      {
		 ctx.save();
		 ctx.font = "10px 'arial'";
		 ctx.fillStyle = "#000";
		 for(index=0; index<gValues.length; index++)
	     {
		 ctx.fillText(xLabels[index], x(index), gHeight+17);
		 }
		 ctx.restore();
      }
A simple function to render the labels of the x axis. We first save the current state of the canvas including all the rendering settings so that anything we do inside the functions never leaks out. Then we set the size and font of the labels. Next, we iterate through the xLabels array and call the fillText method each time to render the label. We use the x function to aid us in the positioning of the labels.
function drawYlabels()
      {
		 ctx.save();
	     for(index=0; index<numYlabels; index++)
	      {
		   yLabels.push(Math.round(maxVal/numYlabels*(index+1)));
		   ctx.fillStyle = "#000";
		   ctx.fillText(yLabels[index], xOffset, y(yLabels[index])+10);
	       }
	       ctx.fillText("0", xOffset, gHeight+7);
		   ctx.restore();
      }
A slightly more verbose function. We first save the current state of the canvas and then proceed. Next we divide maxVal’s value into n elements where the variable numYlabels dictates n. These values are then added to the yLabels array. Now, as shown above, the fillText method is called to draw the individual labels with the y function aiding us in the positioning of each individual label.
We render a zero at the bottom of the canvas to finish drawing the Y labels.
function drawGraph ()
	 {
	    for(index=0; index<gValues.length; index++)
	      {
		    ctx.save();
			ctx.fillStyle = "#B7B7B7";
	        ctx.fillRect( x(index), y(gValues[index]), width(), height(gValues[index]));
		    ctx.restore();
	      }
	 }

The function which draws the actual bars in the bar graph. Iterates through the gValues array and renders each individual bar. We use the fillRect method to draw the bars. As explained above, the method takes four parameters, each of which is taken care of by our utility functions. The current index of the loop is passed to our functions as parameters along with the actual value held in the array, as needed.
The x function returns the x co-ordinate of the bar. Each time, it is incremented by the value of the sum of barWidth and barSpacing variables.
The y function calculates the difference between the height of the canvas element and the normalized data and returns it. I know this sounds a bit topsy turvy, but this is due to the fact that the y values on the canvas grid increase on moving down while in our graph the y values increase on moving up. Thus, we have to do a little work to make it function the way we wish.
The width function returns the width of the individual bars themselves.
The height function just returns the normalized value which is going to be used as the height of the bar to be drawn.
In this first part, we’ve implemented the base logic of our plug-in as a standalone version with bare bones looks and features. We reviewed the canvas coordinate system, the rectangle rendering methods, some nifty data extraction using jQuery’s innate awesomeness [Have I mentioned how much I like jQuery?], looked at how the labels are drawn, and finally looked at the logic behind the rendering of the graph itself.
At the end of this article, the output should look like so.

Our current implementation is rather lacking really. It looks bland, can’t create multiple graphs on the same page, and let’s face it, is rather spartan on the features front. We are going to tackle all of that next week. In the next article we will:
Questions? Criticisms? Praises? Feel free to hit the comments. Thanks for reading and, when you’re ready, move on to part two!
Fix Reservation Form
I have a reservation form. The form page and script is in PHP. When a reservation is submitted, it says there is an error even though the fields are filled out correctly.
I need for you to find and fix this problem and make sure the form is submitting properly for all ranges of input. It might be easy but it might not.
I will not send the page URL until I award you the project. At that time you can look at the website before accepting the project.
After you accept, I will give you FTP login info and you will need to fix it whatever the problem is.
Here are some screenshots:
http://174.132.166.251/~outsourc/Screenshots/Public/2010-04-08_1333.png
http://174.132.166.251/~outsourc/Screenshots/Public/2010-04-08_1333.png
I just do not have time to do this myself.
Thanks,
Daniel
Fix Mysql Web Application
I have lost data from mySQL database web application. So i tried to access it yesterday to take a look and access was denied. So i had to change password from the server. took a fast look and exit. nothing more: Result, a bug. on the webpage and the login page
My need is:
1. Access the database and reconnect the login page to the right adress
2. check if any hole or bug in the database (cause of the information loss) and fix it
3. See if there is a master password for the login page and change it.
Most important, you must be ready to fix it right now.
website http://www.antoinehalabi.com/proprietes_vedettes.php
login page: http://www.antoinehalabi.com//admin/login.php
Groupon.com Clone
My company is looking into having a clone of groupon.com. Save functionality as offered on that site. Here is a brief description and also a wireframe of the promotion page:
Concept Description
– Registered users can buy coupons online for a wide variety of promotions
– Coupons are only valid when bought in minimum amount, which is set upfront
– Coupons are delivered in a digital format after tipping point of promotion is reached
– Coupons can be bought during a limited time period with expiration time set upfront
– Users can discuss promotion on promotion detail page
– Users can share promotions through social media
– Users are regularly notified of new promotions
Process Description
– User needs to sign up to receive access to promotions
– User places order for promotion at promotion detail page, credit card is validated.
– When required order quantity is reached and promotion deadline has been reached, orders are being made final.
– User receives notification with result of promotion offering.
– When promotion is successful, user will be send an e-mail with digital coupon attached in .pdf or image included in e-mail, both in a print-ready format. Coupon should contain a unique ID per transaction. Credit card will be billed.
– When promotion fails, user is notified by e-mail. Credit card is not billed.
Note: Future possible enhancements include unique QR-code generation which can be included in .pdf, mms or e-mail and mobile payment gateway integration.
Virtuemart To Dazzle Connector
I “LOVE” the software called Shipworks by a company called “Interapptive” and have used it for several years. My company is growing from a couple of websites to 100+ by the end of the year and 500+ in total. Currently we use exclusively www.usps.com / US Post Office for outbound shipping. Shipworks charges $15 / month / site and is GREAT for a few sites, but WAY too expensive when you get past 10 sites or so.
I need to have a program or script poll a virtually unlimited number of ecommerce websites (shopping carts) and extract the orders/sales from these sites. This data needs to be able to be used to print out an invoice/packing list (Shipworks has a GREAT XML interface for this) and then the same data needs to be able to interface with a postage/label program or service (Endicia.com through its Dazzle desktop component is my prefered method) to print out my labels for the outbound mailed orders.
Shipworks is a desktop application. A web-interface app would be more appropriate.
My immediate need is to grab the orders, print labels and ship the items. If the created app could talk to the various Joomla/Virtuemart sites and paste in tracking numbers and send email notifications to the customer, it would be awesome.
Endicia has an interface called “Endicia Label Server” that might work as part of a web-based interface and be a replacement for Dazzle, however, for now, Dazzle through its polled directory or preferrably through its command line switches can print the postage (and preform address verifications).
If this project proceeds well. I would expect to hire additional expansions and added functionallity on a semi-regular basis.
I would love for this to be written as a Joomla/Virtuemart Extension. An independent web-app would be my second choice and a Desktop app (which may be the easiest) would be my third choice.
Easy Wp-blog Design
I need someone to customize my blog for me. This should be a very easy job since all I need you to do is add a custom header and background image to my theme. (Header image should include topic related visuals as well as a logo in color)
My domain name is [www.ringweddingsets.com] and my topic is Wedding sets primarily his and hers rings(wedding type theme). So the design should make sense to my domain name and topic.
This should be an easy job for anyone who has designed a wordpress blog before. If everything goes well and the price is right I’ll probably hire the winning bidder for all my future projects. Please, serious bidders only. Need it done ASAP if possible.
Thanks in advance
Derell
Budget: $20-$45
Skills: PHP, Script
Install, Logo Design, WordPress, Website Design
Extra Features: NONE
Shopping Template Design & Php
Im looking for a shopping type template and the needed php changes to use the template with a price comparison script (price tapestry).
Ive attached the default template that comes with the script so you can see how its put togther.
Design needs to web 2.0 shopping/price comparison style that can be used on a few different sites running PT. So doesnt need to have a niche specific look.
Here is an example of the default template in action
http://www.webpricecheck.co.uk
Would prefer someone familiar with price tapestry but not essential.
Please post example of templates on the PMB.
$30 available for this project. If satisfied i will want a couple more templates for this script.
Restaurant Falsh Website 2
In need of experienced FLASH programmer for a restaurant website. I only need the flash on the HOMEPAGE and the BODY of the site in
.CSS and standard HTML. Do I make anysense? You will need to create the entire website with categories such as DINNER MENU, BRUNCH MENU, APPETIZER, etc. There will be approximately 13 to 15 pages. I must be able to EDIT the menu pricing without me needing to purchase any software. I can edit through hardcoding. ie. HTML. You can find the sample template that I like here:
http://www.templatemonster.com/website-templates/25681.html (Template #25681)
You can also view my current dinosaur site: admiralristy.com
Don’t laugh!
I will provide you with 15 images for the site, you will need to enhance these pictures to make it look really nice.
Payment will be made thru escrow and released after I approved the work.
Good luck!
WordPress Expert – Fast Job
I’m looking for a wordpress expert today who can help me fix a couple of bugs in my custom theme.
1. My line breaks aren’t working correctly, I got them to work in posts but not pages.
2. Images aren’t appearing in pages or posts. When I try to insert an image I just get whitespace.
These two issues only happen with this theme so it’s a stylesheet issue. And probably a 5 minute fix for someone.
I’ll pay $10-$20 to anyone that can help me solve fast.. I’ll give link to stylesheet in PMB or can give access to demo blog.
Please don’t bid unless you have positive reviews and wordpress experience listed in your reviews.
Magento Module – Finalize/co 2
We currently have a magento module/code which we need to validate and turn into a finished module. WE do require it to be code to have mysql for easy installation. It does lack that at this time.
JOB INCLUDES
verify code – for bugs
add mysql coding for easy installation
finalize module coding
Python Tactical Website
PROGRAMMER NEEDED FOR COMPREHENSIVE E-COMMERCE WEBSITE
Design & Layout is complete, need someone to convert to JAVA/CSS/XHTML etc. Also need to be expert in E-commerce/back-end development. Preferably someone who can create an easy to use back-end GUI so that client can upload new products, change several images &/or content on website.
Install Mcafee Logo On My Site
*******I need this done ASAP,if you cannot start now please dont bid*******
Hi,
I need a programmer that will install the MacAfee code on my site.
I need the logo installed on 3 different places.
You will also need to do the exact same thing on another site (Clone)
Example of the code:
<!– START SCANALERT CODE –>
<a target=”_blank” href=”https://www.mcafeesecure.com/RatingVerify?ref=1001sondages.com&lang=FR”><img width=”94″ height=”54″ border=”0″ ************EXAMPLE*******************; return false;”></a>
<!– END SCANALERT CODE –>
Clients Only
Who are we?
We are known as Wit witch.
We are producing quality content for more then 3 years now. We provide not only quality but we also value the content and information. W e are fully aware of the importance of SEO and we know how important it is to be on top of the search engines rankings. So for this we provide not only SEO rich and search engine friendly articles that will boost up your site’s traffic .but provide information and stuff that a reader wants to read about. So all this can build up a trust between you and your viewer. So in short term Wit Witdh is: Your best solutions for Web and Writing Problem.
Skills:
Excellent content on every niche you can think of
SEO specialist
Web content Developer
Content Manager
Article writers
Great quantity plus maintaining the quality. Great Native writers Always meet deadlines Provide work on almost every niche you can think about. Hard working and passionate about what we do. Best SEO team available. With Our SEO articles and content your traffic chart will be SKy high. Your Satisfaction is what we aim for.
We provide quality articles on $5 per 300word article.
Special discount if you hire us for more then 300 articles.
Samples can be provided if asked.
Looking forward to work with you.
Best Regards