How to Create an App with the Myows API

How to Create an App with the Myows API

In their own words: “Myows is an easy-to-use app dedicated to providing a full suite of copyright solutions, from registration to management. Myows has been created for designers, photographers, bloggers, writers, musicians and anyone who creates copyrightable work.” In this weekend supplementary tutorial, a member of the Myows team will demonstrate how to create your own apps using the Myows API.


Take Fuss-Free Copyright Management to the Next Level.

Get your hands dirty with Myows’ publicly available API, fresh from the desks of our globally-scattered development team. This brings us one step closer to our platform-vision: helping the planet’s switched-on creative community help themselves. We’re looking for Myows members to help us add further functionality to the existing app at Myows.com. The brief is straightforward:


Registering your Application

Get the Flash Player to see this player.


Create a Simple Sort and Display App Using the Myows API

Get the Flash Player to see this player.


4-Steps API Challenge

In fact, Myows is hosting a competition on their site right now.

“We’re looking for plug-ins, add-ons and stand alone applications that improve the user experience and add useful functionality. To participate, you’ll need to create a thread before 15th May in our API forum category and provide a link to a demo of you app.”


Photoshop to HTML: Upcoming eBook from Nettuts and Rockable

Photoshop to HTML: Upcoming eBook from Nettuts and Rockable

There’s a reason why our various tutorials on slicing PSDs are consistently among the most popular articles on Nettuts. Every one of us, at one point or another, has needed to convert a PSD into a working website. The only problem is that, until you’ve gotten a few projects under your belt, it can be significantly confusing. As such, I was asked to prepare a book and video series that details the entire process from start to finish for Rockable Press.


1. What You’ll Learn in this Book and Video Series

  1. Different methods for slicing a PSD.
  2. Create semantic mark-up, and learn how this HTML relates to the original PSD.
  3. How to utilize techniques, such as background replacement and sprite generation.
  4. Use custom fonts with Cufon font replacement.
  5. The differences between absolute and relative positioning.
  6. How to compensate for the dreaded Internet Explorer 6.
  7. Take advantage of advanced CSS3 features.
  8. How to take advantage of a variety of helpful browser extensions to expedite your coding.
  9. Utilize the jQuery library to add a touch of interactivity.
  10. And plenty more…

2. Accommodates All Learning Styles

What we'll be converting to a fully functioning html/css website

Over the course of the book, we’ll build the fully functioning website, shown above.

Prefer the written word, perhaps even on your new iPad? If so, the immediately downloadable PDF can be viewed on your computer, or any of your eReaders. On the other hand, if you’re more of a visual learner, like myself, and would prefer to have someone “sit next to you,” so to speak, through the entire process, I’ve also included the book in video form, separated into a dozen chapters, where I slowly and succinctly explain each step.


3. Rockable Members Receive a Discount

Rockable Press

If you’re not a Rockin’ List member yet, why not? Did you know that, if you sign up (quick and free), you’ll immediately receive Skellie’s – our awesome Tuts manager – “Rockstar Personal Branding” mini-book for free?

Not only that, but when my book launches (very soon), you’ll receive a discount on the book. Signup for the Rockin’ List.


So if you’re at the point in your learning where this would be helpful to you, I really do hope you’ll consider picking up this ebook and highly in depth video series when it launches very soon!

Photoshop to HTML

In “Photoshop to HTML”, Nettuts+ editor and author Jeffrey Way will take you through the entire process of converting a design from Photoshop into a complete HTML/CSS website! This book also comes with the completed demo site, which you’re free to use as you wish in your own projects. But not only that, you also get an additional series of screencasts where Jeffrey covers the entire process from start to finish. So you have the choice of either reading or viewing!


Quick Tip: Learning About HTML5 Local Storage

Quick Tip: Learning About HTML5 Local Storage

In today’s video quick tip, we’re going to build a working, though very basic, to-do list in just a minute or two. Thanks to HTML5’s local storage, we can make advanced browsers “remember” what we type, even after the browser is closed or is refreshed.

“localStorage sets fields on the domain. Even when you close the browser, reopen it, and go back to the site, it remembers all fields in localStorage.”
QuirksBlog

While obviously not supported across all browsers, we can expect this method to work, most notably, in Internet Explorer 8, Safari 4, and Firefox 3.5. Note that, to compensate for older browsers that won’t recognize local storage, you should first test to determine whether window.localStorage exists.

Support matrix

via http://www.findmebyip.com/litmus/


WordPress tip: Allow contributors to upload files

WordPress tip: Allow contributors to upload files

Nothng hard with this code: The only thing you have to do is to paste it in your functions.php file:

if ( current_user_can('contributor') && !current_user_can('upload_files') )
    add_action('admin_init', 'allow_contributor_uploads');

function allow_contributor_uploads() {
    $contributor = get_role('contributor');
    $contributor->add_cap('upload_files');
}

Big thanks to Altaf Sayani for his contribution to WpRecipes!

Looking for WordPress hosting? Try WP Web Host. Prices starts at $5/month and you can try it for free!

WordPress tip: Allow contributors to upload files

Implementing HTML5 Drag and Drop: New Premium Tutorial

Implementing HTML5 Drag and Drop: New Premium Tutorial

One of the new features in HTML5 is native drag and drop. Surprisingly, Internet Explorer has had support for this since version 5.5; in fact, the HTML5 implementation is based on IE’s support. In this week’s Premium tutorial and screencast, we’ll look at how to implement native drag and drop to build a simple shopping cart interface.

Final Product

Not a Premium Member? Get More out of Nettuts+!

A ONE Premium membership gives you access to members-only content for ALL our Premium sites. Read more about the great value you’ll also get from Psd Premium, Ae Premium, Audio Premium and Vector Premium as part of your membership.

If you want to experience everything Nettuts+ has to offer, you’ll need to go Premium. Here are three reasons to join our community of over 10,000 happy Premium members:


1. Exclusive Bonus Tutorials Teaching Professional Web Dev Techniques

Once a week Premium members gain access to a bonus tutorial at Nettuts+. We understand that joining Premium is an investment in your skills as a web developer. We want to make sure that investment pays off. Because of this, each Premium tutorial teaches skills that professional web developers can use to add extra value for clients and, in doing so, add extra value to your business.

Premium tutorials are authored by accomplished web developers, industry leaders, Nettuts+ editor Jeffrey Way and other names you’ll recognize. Each tutorial focuses on coding languages and frameworks many web developers are proficient in, such as CSS, XHTML, Javascript, PHP and MySQL.

  • See exactly how the code is built, line by line;
  • Learn sought-after techniques clients will pay big bucks for;
  • Undertake challenging exercises that raise your skills to another level.

Join Now

“I did the quarterly deal, not to save money, but to not have to worry about it for 3 months. I wish there was an annual option. $9/month is a steal for the quality of content available here.” — Adam Jackett on Psd Premium


2. Screencasts Make Learning Complicated Techniques Easy

Net Premium tutorials will always have accompanying video, whether they are pure screencasts or written tutorials with a video companion. At Tuts+ we’ve found that video lessons provide the clearest and most engaging training platform.

  • Stream or download video lessons to watch at your own pace;
  • Engaging commentary means lessons are never dry.

Join Now

“I pay—well, my wonderful parents pay—over $500 for my PCgraphics class, and I have learned more in a $9 subscription period of one month here than all year at school.” — Nico Valencia on Psd Premium


3. Show Your Love and Contribute to Nettuts+

Every month we spend many thousands of dollars on this site, sourcing the best tutorial writers, paying for community contributions, keeping hosting and bandwidth running smoothly and adding new features and improvements all designed to create the best possible user experience.

Our commitment is to provide the best web development site on the web. As a Premium member you’ll be contributing to help make this site even better than it already is.

Join Now

“This is the cleanest, most professional PSD tutorial website on the net and the small monthly fee is nothing compared to the quality of material here. Keep up the good work.” — mattems on Premium


What does it cost?

Premium membership is $9 a month, or $22 for three months, or $78 for one year. For the cost of a magazine subscription you can get access to all of the following:

  • Weekly video lessons by industry leaders;
  • Access to all past and future video lessons;
  • Sought-after techniques in web development across a range of common coding languages and frameworks;
  • Access to our Tuts+ Dashboard, bonus content and features.
  • Full access to Net Premium, Audio Premium, Ae Premium and Vector Premium.

“$9 is cheap for what you give me.” — Ryan on Premium


Worth $9? We think so.

And that’s why if you’re not satisfied, you can get your money back, in full. It’s our 100% money back guarantee. Just follow these instructions and we’ll give you a full refund.

Remember, your Net Premium membership also grants you access to Vector Premium, Audio Premium, Ae Premium and Psd Premium. That’s five Premium programs for one small membership fee.

So what are you waiting for?

Join Now

Once you’re a member, login at the Tuts+ Dashboard and go to ‘Premium Content’ to claim your downloads.


Fun with Canvas: Create a Bar Graphing Plugin, Part 2

Fun with Canvas: Create a Bar Graphing Plugin, Part 2

In this two-part series, we’ll combine the versatile canvas element with the robust jQuery library to create a bar graphing plugin. In this second part, we are going to convert it in to a jQuery plugin, and then add some eye candy and additional features.

Concluding the Fun with canvas two-part series, today we are going to create a bar graphing plugin; not an ordinary plug in, mind you. We are going to show some jQuery love to the canvas element to create a very robust plugin.

In part one, we looked solely at implementing the logic of the plug in as a standalone script. At the end of part one, our bar graph looked like so.


Result at the end of Part 1

In this final part, we’ll work on converting our code and making it a proper jQuery plugin, adding some visual niceties and finally including some additional features. Ultimately, our output will look like so:
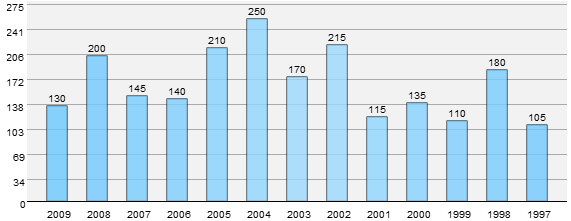

Finished product

All warmed up? Lets dive in!


Plugin Formalities

Before we start converting our code into a plugin we first need to look at a few formalities when it comes to plugin authoring.


Naming the Plugin

We begin by choosing a name for the plugin. I’ve chosen barGraph and renamed the JavaScript file to jquery.barGraph.js. We now enclose all the code from the previous article inside the following snippet.

$.fn.barGraph = function(settings) {
//code here
}

Settings contains all of the optional parameters passed to the plugin.


Working Around the $ Symbol Issue

In jQuery plugin authoring, it is generally considering a best practice to use jQuery instead of the $ alias in your code, in order to minimize conflicts with other Javascript libraries. Instead of going through all that trouble, we can just use custom aliases as mentioned in the jQuery docs. We enclose all our plugin code within this self executing anonymous function, as shown below:

(function($) {
$.fn.barGraph = function(settings) {
//plugin implementation code here
}
})(jQuery);

Essentially, we encapsulate all our code within a function and pass jQuery to it. We are free to use the $ alias as much as we want inside our code now, without having to worry about it potentially conflicting with other JavaScript libraries.


The Defaults

When designing a plugin, it is good sense to expose a reasonable number of settings to the user, whilst using sensible default options if the users uses the plugin without passing any options to it. With that in mind, we are going to enable the user to change each of the graph option variables I mentioned in this previous article in this series. Doing so is easy; we just define each of these variables as properties of an object and then access them.

var defaults = {
	         barSpacing = 20,
	 		 barWidth = 20,
	    	 cvHeight = 220,
			 numYlabels = 8,
			 xOffset = 20,
			 maxVal,
			 gWidth=550,
			 gHeight=200;
           }; 

We finally need to merge the default options with the passed options, giving preference to the passed ones. This line takes care of that.

var option = $.extend(defaults, settings);  

Do remember to change the variables names wherever necessary. As in –

return (param*barWidth)+((param+1)*barSpacing)+xOffset;

…changes to:

return (param*option.barWidth)+((param+1)*option.barSpacing)+option.xOffset;

Refactoring

This is where the plugin is hammered out. Our old implementation could only produce a single graph in a page, and the ability to create multiple graphs in a page is the main reason we are creating a plugin for this functionality. Plus, we need to make sure that the user doesn’t need to create a canvas element for every graph to be created. With that in mind, we are going to create the canvas elements dynamically as needed. Let’s proceed. We’ll look at the earlier and updated versions of the relevant portions of the code.


Invoking the Plugin

Before we start, I’d like to point out how our plugin will be invoked.

$("#years").barGraph
   ({
		 barSpacing = 30,
        barWidth = 25,
		 numYlabels = 12,
   });

Simple as that. years is the ID of the table holding all our values. We pass in the options as needed.


Obtaining the dataSource

To start things off, we first need a reference to the source of data for the graphs. We now access the source element and obtain its ID. Add the following line to the bunch of graph variables we declared earlier.

var dataSource = $(this).attr("id");

We define a new variable and assign it the value of the passed element’s ID attribute. Within our code, this refers to the currently selected DOM element. In our example, it refers to the table with an ID of years.

In the previous implementation, the ID for the data source was hard coded in. Now we replace that with the ID attribute we extracted earlier. The earlier version of the grabValues function is below:

function grabValues ()
	 {
	 	// Access the required table cell, extract and add its value to the values array.
		 $("#data tr td:nth-child(2)").each(function(){
		 gValues.push($(this).text());
	 	 });

		 // Access the required table cell, extract and add its value to the xLabels array.
		 $("#data tr td:nth-child(1)").each(function(){
	 	xLabels.push($(this).text());
	 	 });
	 } 

It is updated to this:

function grabValues ()
	 {
     	// Access the required table cell, extract and add its value to the values array.
	 	$("#"+dataSource+" tr td:nth-child(2)").each(function(){
		 gValues.push($(this).text());
	 	 });

		 // Access the required table cell, extract and add its value to the xLabels array.
		 $("#"+dataSource+" tr td:nth-child(1)").each(function(){
	 	xLabels.push($(this).text());
	 	 });
	 } 

Injecting the Canvas Element

function initCanvas ()
	 {
		 $("#"+dataSource).after("<canvas id=\"bargraph-"+dataSource+"\" class=\"barGraph\"> </canvas>");

         // Try to access the canvas element
     	cv = $("#bargraph-"+dataSource).get(0);

	 	if (!cv.getContext)
	 	{ return; }

     	// Try to get a 2D context for the canvas and throw an error if unable to
     	ctx = cv.getContext('2d');
	 	if (!ctx)
	 	{ return; }
	 }

We create a canvas element and inject it into the DOM after the table, which acts as the data source. jQuery’s after function comes in really handy here. A class attribute of barGraph and an ID attribute in the format barGraph-dataSourceID is also applied to enable the user to style them all as a group or individually as needed.


Cycling through the passed elements

There are two ways you could invoke this plugin actually. You could either create each graph separately passing in only one data source or you could pass in a number of sources. In the latter case, our current construct will encounter an error and quit. To rectify this, we use the each construct to iterate over the set of passed elements.

(function($){
	$.fn.barGraph = function(settings) {

	// Option variables
	var defaults = {
	         // options here
           };  

	// Merge the passed parameters with the defaults
    var option = $.extend(defaults, settings);  

	// Cycle through each passed object
	this.each(function() { 

	// Implementation code here
	});

	// Returns the jQuery object to allow for chainability.
	return this;
	}
})(jQuery);

We encapsulate all code after obtaining and merging the settings inside the this.each construct. We also make sure to return the jQuery object at the end to enable chainability.

With this, our refactoring is complete. We should be able to invoke our plugin and create as many graphs as needed.


Adding Eye Candy

Now that our conversion is complete, we can work on making it visually better. We are going to do a number of things here. We’ll look at each of them separately.


Themes

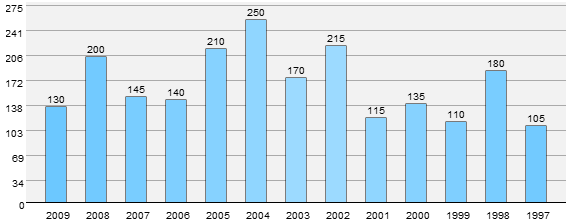
The older version used a bland gray to draw the graphs. We are going to implement a theming mechanism for the bars now. This, by itself, consists of a series of steps.


Ocean: The default theme
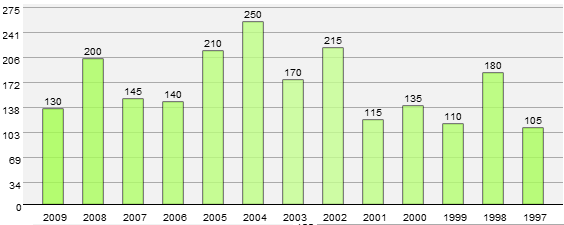
Foliage
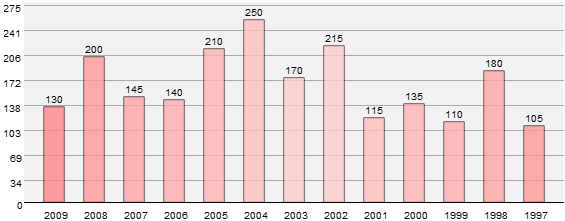
Cherry Blossom
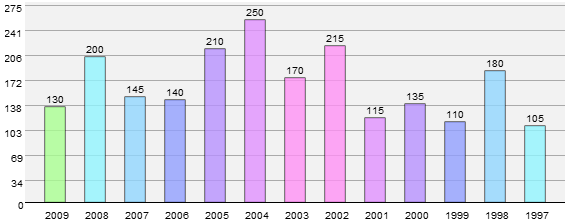
Spectrum

Adding it to the Options

var defaults = {
             // Other defaults here
	 	 	 theme: "Ocean",
           }; 

We add a theme option to the defaults enabling the user to change the theme to any of the four presets available.

Setting the Currently Selected Theme

function grabValues ()
	 {
	 	// Previous code

		switch(option.theme)
		{
			case 'Ocean':
			gTheme = thBlue;
			break;
			case 'Foliage':
			gTheme = thGreen;
			break;
			case 'Cherry Blossom':
			gTheme = thPink;
			break;
			case 'Spectrum':
			gTheme = thAssorted;
			break;
		}
	 }  

A simple switch construct looks at the option.theme setting and points the gTheme variable to the necessary colours array. We use descriptive names for the themes instead of generic ones.

Defining the Colours Array

// Themes
	var thPink = ['#FFCCCC','#FFCCCC','#FFC0C0','#FFB5B5','#FFADAD','#FFA4A4','#FF9A9A','#FF8989','#FF6D6D'];
	var thBlue = ['#ACE0FF','#9CDAFF','#90D6FF','#86D2FF','#7FCFFF','#79CDFF','#72CAFF','#6CC8FF','#57C0FF'];
	var thGreen = ['#D1FFA6','#C6FF91','#C0FF86','#BCFF7D','#B6FF72','#B2FF6B','#AAFE5D','#A5FF51','#9FFF46'];
	var thAssorted = ['#FF93C2','#FF93F6','#E193FF','#B893FF','#93A0FF','#93D7FF','#93F6FF','#ABFF93','#FF9B93']; 

We then define a number of arrays, each holding a series of shades of a specific colours. They start off with the lighter hue and keep on increasing. We’ll loop through these arrays later. Adding themes is as simple as adding an array for the specific colour you need, and then modifying the earlier switch to reflect the changes.

The Helper Function

function getColour (param)
      {
         return Math.ceil(Math.abs(((gValues.length/2) -param)));
	  } 

This is a tiny function which lets us achieve and apply a gradient like effect to the graphs. Essentially, we compute the absolute difference between half of the number of values to be rendered and the passed parameter, which is the index of the currently selected item in the array. This way, we are able to create a smooth gradient. Since we’ve only defined nine colours in each of the colours array, we are limited to eighteen values a graph. Extending this number should be fairly trivial.

Setting the fillStyle

function drawGraph ()
	 {
	    for(index=0; index<gValues.length; index++)
	      {
		    ctx.save();
			ctx.fillStyle = gTheme[getColour(index)];
	        ctx.fillRect( x(index), y(gValues[index]), width(), height(gValues[index]));
		    ctx.restore();
	      }
	 }

This is where we actually theme the graphs. Instead of setting a static value to the fillStyle property, we use the getColour function to retrieve the necessary index of the element in the currently selected theme’s array.


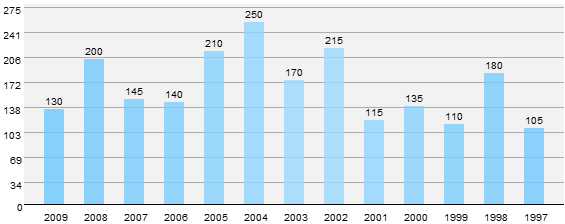
Opacity

Next up, we are going to give the user the ability to control the opacity of the bars drawn. Settings this is a two-step process.

With no transparency

With a value of 0.8

Adding it to the Options

var defaults = {
            // Other defaults here
	 	 	 barOpacity : 0.8,
           }; 

We add a barOpacity option to the defaults, enabling the user to change the opacity of the graphs to a value from 0 to 1, where 0 is completely transparent, and 1 is completely opaque.

Setting the globalAlpha

function drawGraph ()
	 {
	    for(index=0; index<gValues.length; index++)
	      {
		    ctx.save();
			ctx.fillStyle = gTheme[getColour(index)];
            ctx.globalAlpha = option.barOpacity;
	        ctx.fillRect( x(index), y(gValues[index]), width(), height(gValues[index]));
		    ctx.restore();
	      }
	 }

The globalAlpha property controls the opacity or transparency of the rendered element. We set this property’s value to the passed value or the default value to add a bit of transparency. As a sensible default, we use a value of 0.8 to make it just a tiny bit transparent.


Grid

A grid can be extremely useful in processing the data presented in a graph. Though I initially wanted a proper grid, I later settled for a series of horizontal lines lining up with the Y axis labels and completely threw away the vertical lines, since they just got in the way of the data. With that out of way, let’s go implement a way to render it.


With grid disabled

With grid enabled

Creating the lines using paths and the lineTo method seemed to be the most obvious solution for drawing the graphs, but I happened to run into a rendering bug which made this approach unsuitable. Hence I am sticking with the fillRect method to create these lines too. Here is the function in its entirety.

function drawGrid ()
      {
		  for(index=0; index<option.numYlabels; index++)
	      {
		   ctx.fillStyle = "#AAA";
		   ctx.fillRect( option.xOffset, y(yLabels[index])+3, gWidth, 1);
		  }
      }

This is very similar to drawing the Y axis labels, except that instead of rendering a label, we draw a horizontal line spanning the width of graph with a width of 1 px. The y function helps us in the positioning.

Adding it to the Options

var defaults = {
             // Other defaults here
	 	 	 disableGrid : false,
           }; 

We add a disableGrid option to the defaults, enabling the user to control whether a grid is rendered or not. By default, it is rendered.

    // Function calls
    	if(!option.disableGrid) { drawGrid(); }    

We just check whether the user wants the grid to be rendered and proceed accordingly.


Outlines

Now that the bars all are coloured, it lacks accent against a lighter background. To rectify this, we need a 1px stroke. There are two ways to do this. The first, and easiest, way would be to just add a strokeRect method to the drawGraph method; or, we could use the lineTo method to quickly stroke the rectangles. I chose the former route since as before the lineTo method threw some weird rendering bug at me.

With no stroking

With stroking

Adding it to Options

First we add it to the defaults object to give the user control of whether this is applied or not.

var defaults = {
             // Other defaults here
	 	 	 showOutline : true,
           }; 
function drawGraph ()
	 {
	       // Previous code
			if (option.showOutline)
			{
			ctx.fillStyle = "#000";
			ctx.strokeRect( x(index), y(gValues[index]), width(), height(gValues[index]));
			}
			// Rest of the code
	      }
	 }

We check whether the user wants to render the outlines, and, if yes, we proceed. This is almost the same as rendering the actual bars except that instead of using the fillRect method we use the strokeRect method.


Shading

In the original implementation, there is no differentiation between the canvas element itself, and the actual rendering space of the bars. We’ll rectify this now.

With no shading

With shading
function shadeGraphArea ()
      {
	    ctx.fillStyle = "#F2F2F2";
	    ctx.fillRect(option.xOffset, 0, gWidth-option.xOffset, gHeight);
      }

This is a tiny function which shades the required area. We cover the canvas element minus the area covered by the labels of both axes. The first two parameters point to the x and y coordinates of the starting point, and the last two point to the required width and height. By starting at option.offset, we eliminate the area covered by the Y axis labels, and by limiting the height to gHeight, we eliminate the X axis labels.


Adding Features

Now that our graph looks pretty enough, we can concentrate on adding some new features to our plugin. We’ll look at each separately.

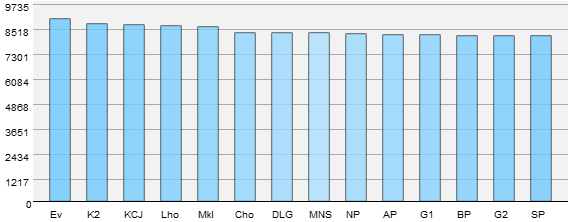
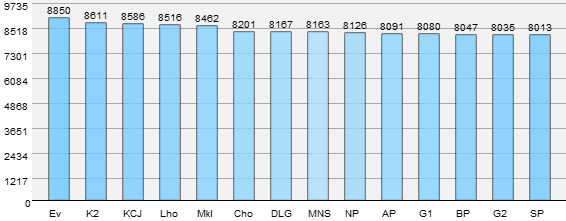
Consider this graph of the famous 8K peaks.

When the highest value is sufficiently high enough, and most of the values fall within 10% of the maximum value, the graph ceases to be useful. We have two ways to rectify this.


ShowValue

We are going to start with the easier solution first. By rendering the value of the respective graphs at the top, the problem is virtually solved since the individual values can be easily differentiated. Here is how it is implemented.

var defaults = {
             // Other defaults here
	 	 	 showValue: true,
           }; 

First we add an entry to the defaults object to enable the user to switch it on and off at will.

    // Function calls
	if(option.showValue) { drawValue(); }

We check whether the user wants the value to be shown and proceed accordingly.

function drawValue ()
      {
		  for(index=0; index<gValues.length; index++)
	      {
		      ctx.save();
			  ctx.fillStyle= "#000";
			  ctx.font = "10px 'arial'";
			  var valAsString = gValues[index].toString();
		      var valX = (option.barWidth/2)-(valAsString.length*3);
		      ctx.fillText(gValues[index], x(index)+valX,  y(gValues[index])-4);
			  ctx.restore();
		  }
      } 

We iterate through the gValues array and render each value individually. The computations involving valAsString and valX are nothing but tiny calculations to aid us in the correct indentations, so it doesn’t look out of place.


Scale

This the harder of the two solutions. In this method, instead of starting the Y axis labels at 0, we start a lot closer to the minimum value. I’ll explain as we go. Do note that, in the above example, the difference between subsequent values with respect to the maximum value is pretty insignificant and doesn’t show its effectiveness as much. Other data sets should give easier to parse results.

Adding it to Options

var defaults = {
             // Other defaults here
	 	 	 scale: false
           }; 

Updating the Scale Function

Since the scale function is an integral part of the rendering process, we need to update it to allow the scaling feature. We update it like so:

function scale (param)
      {
	   return ((option.scale) ? Math.round(((param-minVal)/(maxVal-minVal))*gHeight) : Math.round((param/maxVal)*gHeight));
      }

I know this looks a little complicated, but it looks that way only due to use of the ternary conditional operator. Essentially, we check the value of option.scale and if it says false, the older code is executed. If it is true, instead of normalizing the value as a function of the maximum value in the array, we now normalize it to be a function of the difference between the maximum and minimum values. Which brings us to:

Updating the maxValues Function

We now need to find out both the maximum and minimum value, as opposed to only the maximum we had to before. The function is updated to this:

function minmaxValues (arr)
     {
		maxVal=0;

	    for(i=0; i<arr.length; i++)
	    {
		 if (maxVal<parseInt(arr[i]))
		 {
		 maxVal=parseInt(arr[i]);
	     }
	    }
		minVal=maxVal;
		for(i=0; i<arr.length; i++)
	    {
		 if (minVal>parseInt(arr[i]))
		 {
		 minVal=parseInt(arr[i]);
	     }
		}
	   maxVal*= 1.1;
       minVal = minVal - Math.round((maxVal/10));
	 }

I am sure you could accomplish the same in a single loop without using as many lines of code as me, but I was feeling particularly uncreative at that time so bear with me. With the calculation formalities out of the way, we issue a 5% increase to the maxVal variable and to the minVal variable, we subtract a value equal to 5% of maxVal’s value. This is to ensure the bars don’t touch the top everytime and the differences between each Y axis labels is uniform.

Updating the drawYlabels Function

With all the groundwork done, we now proceed to update the Y axis label rendering routine to reflect the scaling.

function drawYlabels()
      {
		 ctx.save();
	     for(index=0; index<option.numYlabels; index++)
	      {
			  if (!option.scale)
			  {
		  		 yLabels.push(Math.round(maxVal/option.numYlabels*(index+1)));
			  }
			  else
			  {
				  var val= minVal+Math.ceil(((maxVal-minVal)/option.numYlabels)*(index+1));
		  		  yLabels.push(Math.ceil(val));
			  }
		   ctx.fillStyle = option.labelColour;
		   var valAsString = yLabels[index].toString();
		   var lblX = option.xOffset - (valAsString.length*7);
		   ctx.fillText(yLabels[index], lblX, y(yLabels[index])+10);
	      }
		   if (!option.scale)
		   {
	        	ctx.fillText("0", option.xOffset -7, gHeight+7);
		   }
		  else
		  {
		    var valAsString = minVal.toString();
		    var lblX = option.xOffset - (valAsString.length*7);
		    ctx.fillText(minVal, lblX, gHeight+7);
		  }
		  ctx.restore();
      } 

Pretty meaty update if you ask me! The core of the function remains the same. We just check whether the user has enabled scaling and branch off the code as needed. If enabled, we alter the way the Y labels are assigned to make sure they adhere to the new algorithm. Instead of the maximum value divided into n number of evenly spaced numbers, we now compute the difference between the maximum and minimum value, divide it into uniformly spaced numbers, and add it to the minimum value to build our array of Y axis labels. After this, we proceed as normal, rendering each label individually. Since we rendered the bottom-most 0 manually, we have to check whether scaling is enabled and then render the minimum value in its place. Don’t mind the small numerical additions to each passed parameter; it is just to make sure each element of the graph lines up as expected.


Dynamic Resizing

In our previous implementation, we hard coded the dimensions of the graph, which presents significant difficulty when the number of values change. We are going to rectify this now.

Adding it to the Options

var defaults = {
            // Other defaults here
	 	 	 cvHeight: 250, //In px
           }; 

We let the user set the height of the canvas element alone. All other values are calculated dynamically and applied as needed.

Updating the initCanvas Function

The initCanvas function handles all the canvas initialization, and, hence, needs to be updated to implement the new functionality.

function initCanvas ()
	 {
		 $("#"+dataSource).after("<canvas id=\"bargraph-"+dataSource+"\" class=\"barGraph\"> </canvas>");

	 	// Try to access the canvas element
     	cv = $("#bargraph-"+dataSource).get(0);
	 	cv.width=gValues.length*(option.barSpacing+option.barWidth)+option.xOffset+option.barSpacing;
		cv.height=option.cvHeight;
		gWidth=cv.width;
		gHeight=option.cvHeight-20;

	 	if (!cv.getContext)
	 	{ return; }

     	// Try to get a 2D context for the canvas and throw an error if unable to
     	ctx = cv.getContext('2d');
	 	if (!ctx)
	 	{ return; }
	 }

After injecting the canvas element, we obtain a reference to the created element. The canvas element’s width is calculated as a function of the number of elements in the array – gValues , the space between each bar – option.barSpacing, the width of each bar itself – option.barWidth and finally option.xOffset. The graph’s width changes dynamically based on each of these parameters. The height is user modifiable and defaults to 220px with the rendering area for the bar’s itself being 220px. The 20px is allocated to the X axis labels.


Hiding the Source

It makes sense that the user might want to hide the source table once the graph has been created . With this in mind, we let the user decide whether to remove the table or not.

var defaults = {
            // Other defaults here
			 hideDataSource: true,
           }; 
	if (option.hideDataSource) { $("#"+dataSource).remove();}

We check whether the user wants to hide the table and if yes, we remove it completely form the DOM using jQuery’s remove method.


Optimizing our Code

Now that all the hard work has been done, we can review how to optimize our code. Since this code has been written entirely for teaching purposes, most of the work has been encapsulated as separate functions and moreover they are a lot more verbose than they need to be.

If you really want the leanest code possible, our entire plugin, excluding the initialization and computation, can be rewritten within two loops. One looping through the gValues array to draw the bars themselves and the X axis labels; and the second loop iterating from 0 to numYlabels to render the grid and the Y axis labels. The code would look a lot messier, however, it should lead to a significantly smaller code base.


Summary

That’s it folks! We’ve created a high level plugin completely from scratch. We looked at a number of topics in this series including:

  • Looking at the canvas element’s rendering scheme.
  • Some of the canvas element’s rendering methods.
  • Normalizing values enabling us to express it as a function of another value.
  • Some useful data extraction techniques using jQuery.
  • The core logic of rendering the graph.
  • Converting our script to a full-fledged jQuery plugin.
  • How to enhance it visually and extend it even further feature-wise.

I hope you’ve had as much fun reading this as I had writing it. This being a 270-odd line work, I am sure I left out something. Feel free to hit the comments and ask me. Or criticize me. Or praise me. You know, it’s your call! Happy coding!


Fun With Canvas: Create a Bar Graphing Plugin, Part 1

Fun With Canvas: Create a Bar Graphing Plugin, Part 1

In this two-part series, we’ll combine the versatile canvas element with the robust jQuery library to create a bar graphing plugin. In this first part, we are going to code the core logic of the plugin as a standalone version.

Today, we are going to create a bar graphing plugin. Not an ordinary plugin, mind you. We’ll show some jQuery love to the canvas element to create a very robust plugin.

In this two-part article, we will start from the beginning by implementing the logic of the plugin as a standalone script, refactoring it into a plugin and then finally adding all the additional eye candy on top of the plugin code. In this first part, we are going to deal solely with implementing the core logic.

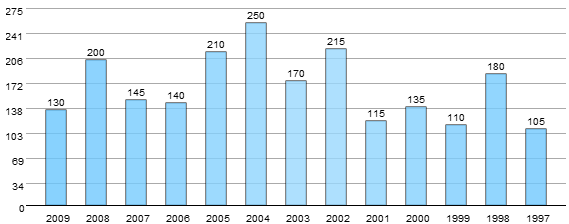
Need an example before we get started? Here you go!


Different graphs created with supplying different settings to our plugin

Satisfied? Interested yet? Let’s start.


Functionality

Our plugin needs to accomplish some basic things whilst not doing some other things. Let me elucidate:

  • As usual, we are going to utilize only the canvas element and JavaScript. No images of any kind, no broken CSS techniques, no prerendering. Plain old (or is it new?) canvas element along with some jQuery to lighten our workload.
  • With respect to the data source, we are going to pull all of the data directly from a standard table. No arrays to pass on the plugin at startup. This way the user can just put all the data in a table and then invoke our plugin. Plus, it is much more accessible.
  • No special markup for the table acting as the data source and definitely no special classes names for the data cells. We are going to utilize only the ID of the table and pull all our data from there.
  • No flimsy text overlay for rendering the labels and such on the graph. It is not only highly tedious but the rendered text isn’t part of the graph when it is saved. We are going to use the fillText and strokeText as defined by the WHATWG specs.

Dependencies

As we are delving into the world of cutting-edge, still not fully specified, technology, we do have some dependencies. For the canvas element to work, most modern browsers are sufficient. But since we make use of the new text rendering API, we need newer builds. Browsers utilizing the Webkit engine r433xx and above or the Gecko engine 1.9.1 and above should be excellent platforms for the plugin. I recommend grabbing a nightly build of Chromium or Firefox.


Before We Start

I’d like to mention that our plugin is purely for learning purposes. This plugin is in no way meant to replace other full-fledged graphing plugins like Flot, Plotr and such. Also the code is going to be as verbose as possible. You could write far, far more efficient code but for the sake of learning, everything is going to be as uncomplicated as possible. Feel free to refactor it in favor of efficiency in your production code.


The HTML Markup

<!DOCTYPE html>
<html lang="en-GB">
<head>
<title>OMG WTF HAX</title>
</head>

<body>

<table width="200" border="0" id="data">

 <tr>
	<th>Year</th>
	<th>Sales</th>
 </tr>

 <tr>
	<td>2009</td>
	<td>130</td>
 </tr>

 <tr>
	<td>2008</td>
	<td>200</td>
 </tr>

 <tr>
	<td>2007</td>
	<td>145</td>
 </tr>

 <tr>
	<td>2006</td>
	<td>140</td>
 </tr>

 <tr>
	<td>2005</td>
	<td>210</td>
 </tr>

 <tr>
	<td>2004</td>
	<td>250</td>
 </tr>

 <tr>
	<td>2003</td>
	<td>170</td>
 </tr>

 <tr>
	<td>2002</td>
	<td>215</td>
 </tr>

 <tr>
	<td>2001</td>
	<td>115</td>
 </tr>

 <tr>
	<td>2000</td>
	<td>135</td>
 </tr>
 <tr>
	<td>1999</td>
	<td>110</td>
 </tr>

 <tr>
	<td>1998</td>
	<td>180</td>
 </tr>

 <tr>
	<td>1997</td>
	<td>105</td>
 </tr>

</table>

<canvas id="graph" width="550" height="220"></canvas>

<script type="text/javascript" src="jquery.js"></script>
<script type="text/javascript" src="mocha.js"></script>

</body>
</html>

Nothing special about the markup. I’ll do a quick overview anyway.

  • We begin by including the requisite doctype. Since we are using the canvas element, we use the appropriate one for HTML 5.
  • The data source table is then defined. Do notice that no special markup is being described or new classes being defined and assigned inside its members.
  • A canvas element is defined and then assigned an ID to later reference it to. This specific canvas element will only be here for the standalone version. In the plugin version, the canvas element and its attributes will be injected dynamically into the DOM and then manipulated as needed. For progressive enhancement this way works out a lot better.
  • Finally, we include the jQuery library and our custom script. As Jeffrey has mentioned time and again, including scripts at the end of the document is always a good idea.

The Canvas Grid

Before we start the Javascript, let me explain the canvas coordinate system. The top-left corner acts as the origin i.e. (0, 0). Points are then measured with respect to the origin with x increasing along the right and y increasing along the left. For the mathematically inclined, we are effectively working in the 4th quadrant except that we take the absolute value of y instead of its negative value. If you have worked with graphics in other languages you should be at home here.


The canvas co-ordinate system

The Rectangle Rendering Routine

Canvas’ rectangle rendering routine will be used extensively through out the article to render the bars, the grid and some other elements. With that in mind, let’s take a short look at those routines.

Of the three routines available, we will be using the fillRect and strokeRect methods. The fillRect method actually fills the rendered rectangle while the strokeRect method only strokes the rectangles. Other than that, both the methods take the same parameters.

  • x – The x coordinate of the point from where to start drawing.
  • y – The y coordinate with respect to the origin.
  • width – Defines the width of the rectangle to be drawn.
  • height – Defines the height of the rectangle.

The Javascript Magic

As always, I highly recommend you to download the source code and have it on the side for reference. It’s easier to look at the big picture and parse each function one by one than look at each function individually and then create the big picture in your mind.


Variable Declaration

	var
		barSpacing = 20,
	 	barWidth = 20,
	    cvHeight = 220,
		numYlabels = 8,
		xOffset = 20,
		gWidth=550,
		gHeight=200;

	var maxVal,
    	gValues = [],
	    xLabels = [],
		yLabels = [];

    var cv, ctx;

Graph variables

  • xLabels – An array which holds the value of the labels of the X axis.
  • yLabels – Same as above except that it contains the values of the Y axis labels.
  • gValues – Array which holds all the graph data we pull off the data source.
  • cv – Variable to point towards the canvas element.
  • ctx – Variable to refer to the context of the canvas element.

Graph Option Variables

These variables hold hard coded values to aid us in positioning and layout of the graph and the individual bars.

  • barSpacing – Defines the spacing between individual bars.
  • barWidth – Defines the width of each individual bar.
  • cvHeight – Defines the height of the canvas element. Hard coded since we created the canvas element beforehand. Plugin version varies in this functionality.
  • numYlabels – Defines the number of labels to be drawn in the Y axis.
  • xOffset – Defines the space between the beginning of the canvas element and the actual graph. This space is utilized for drawing the labels of the Y axis.
  • gWidth, gHeight – Hard coded values holding the dimension of the actual rendering space of the graph itself.

How each variable controls the appearance of the graph

Grabbing the Values

With jQuery’s strong selector engine it becomes very easy for us to get the data we need. Here we have a number of ways to access the necessary elements. Let me explain a few below:

$("tr").children("td:odd").each(function(){
//code here
});

The simplest way to access the necessary rows. Looks for a tr element and then accesses every other td element. Fails miserably when you have more than one table on your page.

$("#data").find("td:odd").each(function(){
//code here
});

A much more straight forward way. We pass in the ID of the table and then access every other row.

$("#data tr td:odd").each(function(){
//code here
});

Same as above except that we just use CSS style selector syntax.

$("#data tr td:nth-child(2)").each(function(){
//code here
});

The version we are going to use today. This way is a lot better if we need to grab data from a different row or, if needed, multiple rows.

The final version looks like so:

function grabValues ()
	 {
	 	// Access the required table cell, extract and add its value to the values array.
		 $("#data tr td:nth-child(2)").each(function(){
		 gValues.push($(this).text());
	 	 });

		 // Access the required table cell, extract and add its value to the xLabels array.
		 $("#data tr td:nth-child(1)").each(function(){
	 	xLabels.push($(this).text());
	 	 });
	 }

Nothing complicated here. We use the snippet of code mentioned above to add the value of the table cell to the gValues array. Next, we do the same except that we access the first table cell in order to extract the requisite label for the x axis. We’ve encapsulated the data extraction logic to its own function for code reusability and readability.


Canvas Initialization

function initCanvas ()
	 {
	 	// Try to access the canvas element and throw an error if it isn't available
     	cv = $("#graph").get(0);
	 	if (!cv)
	 	{ return; }

     	// Try to get a 2D context for the canvas and throw an error if unable to
     	ctx = cv.getContext('2d');
	 	if (!ctx)
	 	{ return; }
	 }

Routine canvas initialization. First we try to access the canvas element itself. We throw an error if unable to. Next up, we try to obtain a reference to the 2d rendering context through the getContext method and throw an error if we’re unable to do so.


Utility Functions

Before we step into the actual rendering of the graph itself, we need to look at a number of utility functions which aid us greatly in the process. Each of them are tiny by themselves, but will be used extensively throughout our code.

Determining the Maximum Value

function maxValues (arr)
     {
		maxVal=0;

	    for(i=0; i<arr.length; i++)
	    {
		 if (maxVal<parseInt(arr[i]))
		 {
		 maxVal=parseInt(arr[i]);
	     }
	    }

	   maxVal*= 1.1;
	 }

A small function which iterates through the passed array and updates the maxVal variable. Do note that we inflate the maximum value by 10% for special purposes. If the maximum value is left as it is, then the bar representing the topmost value will touch the edge of the canvas element which we do not want. With that in mind, a 10% increment is issued.

Normalizing the Value

function scale (param)
      {
	   return  Math.round((param/maxVal)*gHeight);
      }

A small function to normalize the extracted value with respect to the height of the canvas element. This function is used extensively in other functions and directly in our code to express the value as a function of the height of the canvas. Takes a single parameter.

Returning the X Coordinate

function x (param)
      {
	   return (param*barWidth)+((param+1)*barSpacing)+xOffset;
      }

Returns the x ordinate to the fillRect to aid us in the positioning of each individual bar. I’ll explain this a bit more in detail when it is used.

Returning the Y Coordinate

function y (param)
      {
	   return gHeight - scale (param) ;
      }

Returns the y ordinate to the fillRect method to aid us in the positioning of each individual bar. More explanations a bit later.

Returning the Width

function width ()
      {
	   return barWidth;
      }

Returns the width of each individual bar.

Returning the height

function height (param)
      {
	   return scale(param);
      }

Returns the height of the bar to be drawn. Uses the scale function to normalize the value and then returns it to the caller.


Drawing the X Axis Labels

function drawXlabels ()
      {
		 ctx.save();
		 ctx.font = "10px 'arial'";
		 ctx.fillStyle = "#000";
		 for(index=0; index<gValues.length; index++)
	     {
		 ctx.fillText(xLabels[index], x(index), gHeight+17);
		 }
		 ctx.restore();
      }

A simple function to render the labels of the x axis. We first save the current state of the canvas including all the rendering settings so that anything we do inside the functions never leaks out. Then we set the size and font of the labels. Next, we iterate through the xLabels array and call the fillText method each time to render the label. We use the x function to aid us in the positioning of the labels.


Drawing the Y Axis Labels

function drawYlabels()
      {
		 ctx.save();
	     for(index=0; index<numYlabels; index++)
	      {
		   yLabels.push(Math.round(maxVal/numYlabels*(index+1)));
		   ctx.fillStyle = "#000";
		   ctx.fillText(yLabels[index], xOffset, y(yLabels[index])+10);
	       }
	       ctx.fillText("0", xOffset, gHeight+7);
		   ctx.restore();
      }

A slightly more verbose function. We first save the current state of the canvas and then proceed. Next we divide maxVal’s value into n elements where the variable numYlabels dictates n. These values are then added to the yLabels array. Now, as shown above, the fillText method is called to draw the individual labels with the y function aiding us in the positioning of each individual label.

We render a zero at the bottom of the canvas to finish drawing the Y labels.


Drawing the Graph

function drawGraph ()
	 {
	    for(index=0; index<gValues.length; index++)
	      {
		    ctx.save();
			ctx.fillStyle = "#B7B7B7";
	        ctx.fillRect( x(index), y(gValues[index]), width(), height(gValues[index]));
		    ctx.restore();
	      }
	 }

The function which draws the actual bars in the bar graph. Iterates through the gValues array and renders each individual bar. We use the fillRect method to draw the bars. As explained above, the method takes four parameters, each of which is taken care of by our utility functions. The current index of the loop is passed to our functions as parameters along with the actual value held in the array, as needed.

The x function returns the x co-ordinate of the bar. Each time, it is incremented by the value of the sum of barWidth and barSpacing variables.

The y function calculates the difference between the height of the canvas element and the normalized data and returns it. I know this sounds a bit topsy turvy, but this is due to the fact that the y values on the canvas grid increase on moving down while in our graph the y values increase on moving up. Thus, we have to do a little work to make it function the way we wish.

The width function returns the width of the individual bars themselves.

The height function just returns the normalized value which is going to be used as the height of the bar to be drawn.


Summary

In this first part, we’ve implemented the base logic of our plug-in as a standalone version with bare bones looks and features. We reviewed the canvas coordinate system, the rectangle rendering methods, some nifty data extraction using jQuery’s innate awesomeness [Have I mentioned how much I like jQuery?], looked at how the labels are drawn, and finally looked at the logic behind the rendering of the graph itself.

At the end of this article, the output should look like so.


Next Up!

Our current implementation is rather lacking really. It looks bland, can’t create multiple graphs on the same page, and let’s face it, is rather spartan on the features front. We are going to tackle all of that next week. In the next article we will:

  • Refactor our code towards making it a full-fledged jQuery plugin.
  • Add some eye candy.
  • Include some nifty little features.

Questions? Criticisms? Praises? Feel free to hit the comments. Thanks for reading and, when you’re ready, move on to part two!


How To Build a Widget to Display your Buzzing

How To Build a Widget to Display your Buzzing

A couple months ago, Google released a new Twitter-like service, called Buzz. We can use this service to display our latest buzzes on any site. So, in this tutorial, I’ll guide you through the process of building your own Buzz widget.


Step 1. Reading Public Updates from Buzz

At the moment, there’s no API to work with the Buzz service; Google is expected to provide one within the next several months, however, for now, the public updates are available as Atom feeds.

First, we need to get the data from the Buzz service. In order to do so, we’ll setup a PHP script that reads the data from the Buzz service. This script will be a kind of proxy that we’ll use to retrieve the data. By doing this, we can make an AJAX request, and get an XML document that contains desired updates.

Google buzz flow

Here’s the initial PHP code:

header('Content-type: application/xml');	 //Setting up the response content type to XML
$handle = fopen($_GET['url'], "r");		//Open the given URL

if ($handle) {
    while (!feof($handle)) {
        $buffer = fgets($handle, 4096);		//reading the data
        echo $buffer;
    }
    fclose($handle);
}

Save this file as “readfeed.php,” and remember that this is just an example. In a real world project, you should clean the url parameter, and make sure the user is not opening something important on your file system.


Step 2. Creating the Structure of our JavaScript Object

Once we can read this data, we need to build an object that holds our code in JavaScript. Create a new file and name it “buzz-widget.js”. To extend an object, we need to use the “prototype” property; if you have questions about this you should watch the tutorial where Jeffrey shows us how this works with native objects.

The structure of our object will be something like this:

var BuzzReader = function(options){	//Step 1
	//code for the constructor
};

BuzzReader.prototype = {			//Step 2
	renderTo: "",
	proxy	: "readfeed.php",
	user	: "",
	url		: "",
	items	: 10,
	onLoad	: function(){},
	onRender: function(){},

	render	: function(element){

	},

	read	: function(){

	},

	parse	: function(xml,success,response){

	},

	format		: function(date){

	},

	createDate	: function(str){

	}
};

In step one, we created the constructor function for our object. Now, we’re going to check for the required configurations, and read the updates from our proxy.

  • renderTo : the element where the widget will be rendered; this property can be a jQuery selector too.
  • proxy : the URL where we’ll make an AJAX request call to retrieve our data. We already created the PHP file that reads the information from the Buzz service; by default it is “readfeed.php”.
  • user : the Buzz user we want to get the updates from.
  • items : the number of updates we are going to display in the widget.
  • onLoad : an event we’re going to trigger when the data is loaded into the widget; by default, this is an empty function.
  • onRender : this event is triggered when the widget is about to be rendered in the page; empty function by default.

Step 3. The Constructor

Let’s work on the constructor function of our widget.

var BuzzReader = function(options){
	var url = "http://buzz.googleapis.com/feeds/{user}/public/posted";	//Step 1
	jQuery.extend(this,options || {});			//Step 2

	if(this.user === "") throw "The 'user' property is required";	//Step 3
	if(this.renderTo === "") throw "The 'renderTo' property is required";

	if(this.url === "")this.url = url.replace(/{user}/g,this.user);	//Step 4

	this.read();		//Step 5
};

In step one, we defined the URL of the Buzz service from which we are going to retrieve the data. We’ll replace the “{user}” string with the user configuration (see step 4).

In step two, we overrode the default properties with the given options; we used jQuery.extend to do that.

In step three, we checked for the required configurations, one of them is the “user” and the “renderTo”. If one of these is missing, we throw an exception. This will be useful for the developer who uses our plugin.

In step four, we searched for the “{user}” string in the variable “url”, and replaced it with the user whose buzzes we wish to display in our widget.

The last step is very important. Here, we start the process of reading and displaying the information.


Step 4. Reading the Information

We’ve setup the PHP script that pulls the data to our server. Now, we only need to make an Ajax request to retrieve the data with jQuery; let’s look at the following code:

read	: function(){
	this.el = jQuery(this.renderTo);		//Step 1
	this.loader = this.el.append("<div class=\"buzz-loading\"></div>");
	jQuery.ajax({				//Step 2
		url		: this.proxy,
		data	: "url="+this.url,
		context	: this,
		success	: this.parse
	});
},

In step one, we appended a new element to the container, informing the viewer that we’re currently processing information.

In step two, we made the Ajax request. The most important thing is the “context” property; this configuration will allow you to change the context of the function that is called when the server responds. Finally, we set the context to “this” which is the BuzzReader object.

Remember that the PHP script expects the “url” parameter. so don’t forget to send it; when the server responds, the method “parse” is executed.


Step 5. Parsing the XML Document

The Buzz service delivered the data in an Atom feed format, so we need to parse and extract the information we need.

This is an example of the XML document that is returned from the Buzz service:

<?xml version="1.0" encoding="utf-8"?>
  <feed xmlns="http://www.w3.org/2005/Atom"
        xmlns:thr="http://purl.org/syndication/thread/1.0"
        xmlns:media="http://search.yahoo.com/mrss"
        xmlns:activity="http://activitystrea.ms/spec/1.0/">
    <link rel="self"
          type="application/atom+xml"
          href="http://buzz.googleapis.com/feeds/117377434815709898403/public/posted"/>
    <link rel="hub" href="http://pubsubhubbub.appspot.com/"/>
    <title type="text">Google Buzz</title>
    <updated>2009-12-14T20:04:39.977Z</updated>
    <id>tag:google.com,2009:buzz-feed/public/posted/117377434815709898403</id>
    <generator>Google - Google Buzz</generator>
    <entry>
      <title type="html">Buzz by A. Googler from Mobile</title>
      <published>2009-12-14T20:04:39.000Z</published>
      <updated>2009-12-14T20:04:39.977Z</updated>
      <id>tag:google.com,2009:buzz/z12bx5v5hljywtfug23wtrrpklnhf3gd3</id>
      <link rel="alternate"
            type="text/html"
            href="http://www.google.com/buzz/117377434815709898403/DmuNZHSfZ7t/buzz-buzz"/>
      <author>
        <name>A. Googler</name>
        <uri>http://www.google.com/profiles/a.googler</uri>
      </author>
      <content type="html">Bzz! Bzz!</content>
      <activity:verb>http://activitystrea.ms/schema/1.0/post</activity:verb>
      <activity:object>
        <activity:object-type>http://activitystrea.ms/schema/1.0/note</activity:object-type>
        <id>webupdates:[email protected]</id>
        <title>Buzz by A. Googler from Mobile</title>
        <content type="html">Bzz!  Bzz!</content>
      </activity:object>
      <link rel="replies"
            type="application/atom+xml"
            href="http://buzz.googleapis.com/feeds/117377434815709898403/comments/z12bx5v5hljywtfug23wtrrpklnhf3gd3"
            thr:count="0"/>
      <thr:total>0</thr:total>
    </entry>
  </feed>

Once we know the response, we can parse the document quite easily with jQuery.

parse	: function(xml,status){
	var that = this;
	var nodes = jQuery("entry",xml);	//Step 1
	this.el.empty();
	var info = [];
	nodes.each(function(){			//Step 2
		var date = that.createDate(jQuery("published",this).text());
		info.push({
			title		: jQuery("title",this).text(),
			author		: jQuery("author > name",this).text(),
			uri			: jQuery("author > uri",this).text(),
			summary 	: jQuery("summary ").text(),
			content		: jQuery("content:first",this).text(),
			published	: that.format(date),
			updated		: jQuery("updated",this).text(),
			date		: date,
			reply		: jQuery("link[rel=replies]",this).attr("href")
		});
	});
	this.data = info;				//Step 3
	this.onLoad.call(this,info);
	this.render(this.renderTo);		//Step 4
},

We received two arguments: the first is the data, in this case a XML document; the second argument is the text status of the request.

In step one we got all the “entry” nodes; this is the place where our Buzz updates and all the information we need is located. Next, we emptied the container of our widget and created an empty array to store our data as a JavaScript object for each node.

In step two, we iterated through the “entry” nodes and extracted the “title”, “author”, “content” and so on. This is a really simple process; all we have to do is write the selector and set the root for the search, in this case the root is the node “entry.”

I’d like to point out the line where we are extracting the “reply” attribute – the selector looks something like this:

link[rel=replies]

We specified that we want the node “link”, that has an attribute “rel” equal to “replies”. This is important because there are many “link” nodes within each “entry.”

In step three, we created the “this.data” reference to the array that contains our data. After that, we executed the event “onLoad” and passed the information we extracted.

In step four, we executed the render method.

Before we continue with the “render” method, let’s review the “createData” and “format” methods. We call these methods for each entry.

In the “createDate” method, we’re only going to create a new Date object with the given string. The string has the format “2009-12-14T20:04:39.977Z” so we can create the Date object as follows:

createDate	: function(str){
	var date = new Date();
	date.setDate(str.substring(8,10));
	date.setMonth(str.substring(5,7) - 1);
	date.setFullYear(str.substring(0,4));
	date.setUTCHours(str.substring(11,13));
	date.setUTCMinutes(str.substring(14,16));
	date.setUTCSeconds(str.substring(17,19));
	return date;
}

Or we can use a simple regexp to format the string and give it to the Date constructor:

createDate	: function(str){
	//str = '2009-12-14T20:04:39.977Z'
	str = str.substring(0,19).replace(/[ZT]/," ").replace(/\-/g,"/");
	//str = '2009/12/14 20:04:39'
	return new Date(str);
}

In the format method we are going to use the date object we just created, and return the time that is between the publication date and the system local time – for example “11 minutes ago” or “3 hours ago.”

format		: function(date){
	var diff   = (((new Date()).getTime() - date.getTime()) / 1000),
		days   = Math.floor(diff / 86400),
		months = Math.floor(days / 31);

	if (isNaN(days) || days < 0)return date.toString();

	if(days == 0){
		if(diff < 60)return "Just now";
		if(diff < 120)return "1 minute ago";
		if(diff < 3600)return Math.floor( diff / 60 ) + " minutes ago";
		if(diff < 7200)return "1 hour ago";
		if(diff < 86400)return  Math.floor( diff / 3600 ) + " hours ago";
	}else if(days < 31){
		if(days == 1)return "Yesterday";
		if(days < 7)return days + " days ago";
		if(days < 31)return Math.ceil( days / 7 ) + " weeks ago";
	}else{
		if(months == 1)return "A month ago";
		if(months < 12)return Math.ceil( days / 31 ) + " months ago";
		if(months >=12)return Math.floor( days / 365 ) + " years ago";
	}
},

The previous code, though a bit tedious, is pretty straight forward. First, we obtained the difference between the current time, and the publications date in minutes, days and months. After that, we simply compared the results, and returned a string in the correct format.

Now let’s review the “render” method.


Step 6. Creating the GUI

Until now, we’ve only pulled the data from the Buzz server, and parsed the XML document. That means that we are ready to display the information on the screen.

render	: function(element){
	this.onRender.call(this,this);		//Step 1

	var html = [];				//Step 2
	html.push("<ul>");

	for(var i = 0; i < this.items || i < this.data.lenght;i++){
		html.push("<li><strong><a href=\""+this.data[i].uri+"\">"+this.data[i].author+"</a></strong><span>"+this.data[i].published+"</span>"+this.data[i].content+"</li>");
	}
	html.push("</ul>");

	this.el.append(html.join(""));	//Step 3
},

In the first step, we triggered the event “onRender,” this, again, will be useful for the programmer who uses our plugin.

In the second step, we created an array to store our dynamic HTML. After that, we created a list “ul” and then we iterated through our data, creating the “li” node for each item; you probably noticed that the “for” condition has an “or” operator; this allow us to stop the iterations when the array of data ends, or when the index “i” has reached the “items” property defined by the developer who is going to use the plugin.

In the last step, we inserted the HTML into the container using the “append” method.


Step 7. Using the Widget

In order to use our widget we need to create an instance of our class “BuzzReader”, but, before doing so, let’s define where we want to render it. Create an HTML file, and, within the body element, and add the following:

<div id="buzz">
<div>
	<div class="reader"></div>
</div>
</div>

We are going to render our widget inside the div with the class “reader”, let’s create the instance of our widget as follows:

$(function(){

	new BuzzReader({
		renderTo	: "#buzz .reader",
		user	: "nettutsblog",
		items	: 3
	});
});

Don’t forget to import the jQuery library and the “buzz-widget.js” into your HTML file. If everything was configured and coded correctly, you should see something similar to the following image:

Google buzz widget

Step 8. Styling the Widget

Well, we can now see the updates, but it doesn’t look very pretty; we need to style it a bit.

/* step 1 */
body{font-family:"Trebuchet MS",Arial,sans-serif;line-height:24px;font-size:14px;}

/*Step 2*/
#buzz{width:300px;margin:100px auto;border:1px solid #AFAFAF;}
#buzz > div{background-color:#E4E4E4;border:1px solid #F6F6F6;padding:10px;}
#buzz .reader{height:350px;overflow:auto;border:1px solid #F6F6F6;padding:80px 10px 10px 10px;background:#fff url(title.jpg) center 0 no-repeat;}
/* Step 3 */
#buzz ul{margin:0;padding:0;}
#buzz ul li{list-style-type:none;color:#A3A3A3;border-bottom:1px solid #E4E4E4;margin-bottom:5px;padding-bottom:5px;}
#buzz ul li div{color:#777;}
#buzz ul li a{color:#444;text-decoration:none;font-weight:normal;}
#buzz ul li a:hover{text-decoration:underline;}
#buzz ul li span{float:right;}

/* Step 4*/
#buzz .buzz-loading{position:absolute;margin-left:240px;width:16px;height:16px;background:transparent url(ajax-loader.gif) center center no-repeat;}

In the first two steps, we centered the widget on the screen, and set the size, borders and colors for the container; we also added the logo as a header for the widget.

In the last two steps, we set the styles to the dynamic list, we changed the color of the fonts, and we added some margins, borders and paddings to our links.

As a result we have a much more appealing product.

Google buzz widget

Step 9. Creating the Plugin

The last step in this tutorial is to create the jQuery plugin. Let’s modify the “buzz-widget.js” file, adding the following code to the end of the file.

jQuery.fn.buzzReader = function(options){  	//Step 1
	return this.each(function(){
		var opts = options || {};		//Step 2
		opts.renderTo = this;
		new BuzzReader(opts);		//Step 3
	});
};

In the first step, we simply named our plugin.

In step two, we created the configuration object if the argument “options” is empty. Next, we defined the property “renderTo” to the actual element.

In step three, we created a new instance of our widget.

Now, we can use our plugin in our HTML, like this:

$(function(){
	$("#buzz .reader").buzzReader({
		user	: "nettutsblog",
		items	: 3
	});
});
Google buzz widget

Conclusions

I hope you’ve learned a bit about how to extract data from XML documents, and display your latest Buzzes on any website. Any questions? Thanks for reading!


Best practices for WordPress coding

Best practices for WordPress coding

Think International

When coding a WordPress theme or plugin, you have to think about those that doesn’t speak English. Using the PHP language, two very useful functions are available for you to create a translatable theme or plugin:

The first is the function _e(), which prints on screen the desired text, translated into the user language:

_e("Text to translate", "textdomain");

The second is __() wich is basically the same than _e(), but returns the text:

function say_something() {
    return __("Text to translate", "textdomain");
}

By using those functions, you make your work translatable in any language, which is a very great thing for people that blog in another language than English.

Additional resources:

Don’t reinvent the wheel: Use a framework

While many people thinks that a good developer is someone that can create quality code, they’re wrong: A good developer is a person who can write quality code, quickly. Being fast is a quality, because clients don’t want to wait, and time is money.

Being fast doesn’t mean writing crappy, untested code in order to get things done as soon as possible. Instead, being fast is all about not wasting time. In development, the most important waste of time someone can do is when you’re reinventing the wheel, i.e. recreating something instead of using the original.

Theme frameworks appeared in 2008. A theme framework is a WordPress theme which can be extended by a child theme. While there are many available frameworks, both free and premium, my favorite is definitely Thematic. You have to learn how Thematic works, which can take some time at first, but once done, you’ll be surprised by how fast you can create robust and optimized themes.

And for those who think that a framework doesn’t allow enough modifications to create any type of layout, you’re wrong: This site and CatsWhoBlog are both using Thematic.

Additional resources:

Speed up development using community tools and templates

As a WordPress developer, most client requests I got were similar: They wanted a custom theme or plugin. The process of creating files and fill it with the required info (Such as plugin name, url, etc) is very simple but time consuming.

For this reason, you should definitely make use of what the community created for you: Themes and plugins templates, as well as a really interesting plugin called WP Dummy Content, which can automatically generate a bunch of pages, sub-pages, posts, etc for you to test the look and feel of the theme you’re building.

Resources

  • The WordPress Starter Theme Project: A very useful set of files containing a blank style.css with theme name, author, URL, etc. tags at the top, a content-ready 404, archive, search, index, single post, and page files, a full, working comments.php file, a complete header.php set up with links to RSS, a stylesheet, and JS file and all you need to start developing a new WordPress theme.
  • WP Dummy Content: a WordPress plugin that will generate a bunch of pages, sub-pages and posts which you specify. Titles and content are automatically generated for you as well, and you have a few choices as to the type and length of content.

Debug your code efficiently

As a developer, debugging code is something that you should be used to. Although debugging is rarely a bunch of fun, WordPress has some useful functions that will definitely make your life easier.

The WP_DEBUG constant has to be placed in your wp-config.php file. If defined and set to true, error messages will be displayed.

define('WP_DEBUG', true);

If you’d like to modify WordPress built-in Javascript, you can enable debugging by defining the SCRIPT_DEBUG constant.

define('SCRIPT_DEBUG', true);

Additional resources

  • WordPress debug techniques: An interesting guide for those who don’t want to spend hours debugging their code.
  • Debug Theme, by Joost: The “Debug Theme” is a very special WordPress theme: instead of making your blog looking good, its purpose is to display useful information such as WordPress constants, security key-phrases, etc. A very handy tool when it comes to debugging!
  • Theme Tester plugin: If you need to modify or create a new theme on a production site, this is a must have: This plugin allows you to show the regular theme to your visitors while you’re working on a new one.

Make use of hooks, actions and filters

WordPress has very interesting an useful features called actions and filters. While those are intensively used by Theme frameworks and some plugins, most newcomer’s in WordPress development are ignoring them.

Actions and filters allow you to modify, overwrite or surcharge an existing WordPress function, without having to edit the core files. For that reason, you should always make sure that both the wp_head() and wp_footer() functions have been implemented in the theme you coded:

<?php wp_head(); ?&gt
    ....
<?php wp_footer(); ?&gt

Using hooks, you can for example add a favicon to your theme without editing the header.php file. The following example is what I use to add a favicon to a Thematic child theme.

function add_favicon() { ?>
    <link rel="shortcut icon" href="<?php echo bloginfo('stylesheet_directory') ?>/images/favicon.png"/>
<?php }
add_action('wp_head', 'add_favicon');

Additional resources

Code markup like a pro

A very important aspect of the quality of a WordPress theme is definitely how it is coded. In fact, I know many developers which are very good in PHP and other back-end technologies, but suck at front-end coding.
WordPress is XHTML valid and standard-compliant, so always make sure that your theme or plugin is as well before selling it to your client.

The idea of “pro front-end coding” is quite subjective, because not everyone has the same quality standards. However, any WordPress theme or plugin should be:

  • XHTML valid: Although their usefulness is often discussed, in clients eyes, respect of web standards makes the difference between a poorly skilled amateur and a professional web developer.
  • Semantically coded: When html tags are used semantically, this is not only the proper way to create a html document, it will also allow your client to get better search engine optimization results.
  • No inline styles or Javascript actions: In-line styles always seem extremely useful at first, but when you have to modify someone else’s work and it’s filled with in-line styles, it quickly become a nightmare. Same goes for javascript actions, such as onmouseover and so on. Always put them in a separate file.

To learn more about front-end coding best practices, you should definitely have a look to my recent “Top 10 best practices for front-end web developers” article.

Like CatsWhoCode? If yes, don’t hesitate to check my other blog CatsWhoBlog: It’s all about blogging!

Best practices for WordPress coding

ASP.NET from Scratch: SQL Server

ASP.NET from Scratch: SQL Server

Part four of this series changes the lesson plan again! This lesson introduces you to Microsoft SQL Server 2008 and SQL Management Studio. Youíll learn how to create a database, add tables to it, and populate it with data. You’ll then use that data and bind it to a template control.

The Complete Series


Lesson 4: SQL Server


Sell ASP.NET Components on CodeCanyon

Did you know that you can sell your ASP.NET scripts and components on CodeCanyon? Simply sign-up for a free author account, and start selling!


Quick Overview: A Few Moments with Titanium

Quick Overview: A Few Moments with Titanium

Those of you who follow us on Twitter might know that I’m currently working on an iPhone app for the tutorial sites. However, there’s just one problem: I have no Objective-C experience! Luckily, a service called Appcelerator allows us to build native desktop and mobile (iPhone in my case) apps using the web technologies that we already know, like JavaScript! Before we launch an in-depth two-part series detailing how to create and sell an iPhone app from scratch later this month, I thought I’d give you a basic overview of how it works.


Color Inspiration: Go Green with Envy

Color Inspiration: Go Green with Envy

Green is most often associated with nature, money, and success. Because of this, it’s most often seen on either environmental or financial institution websites. Though it mixes well with a variety of other colors, green is most often paired with neutrals. We’ve compiled twenty five perfect examples of this in today’s inspiration round-up.


Interactive Logistixs


Old Guard


Logo Labs


bornintents


Rype Arts


RedBrick Health


The Organic Supermarket


Candy Bouquet


OnePromo


Verdeo


Tolingo


Futurice


Plant With Purpose


Coachworks Consulting


Gowalla


Free Gobbler


Chris Kaufman


Apop.jp


Sage Blue


Jones and Palmer


Shashi Tharoor


Nathan Sanders


Leetgeek


You Grow Girl


Evernote


How to display an incrementing number next to each published post

How to display an incrementing number next to each published post

The first thing to do is to paste the function into your functions.php file:

function updateNumbers() {
  global $wpdb;
  $querystr = "SELECT $wpdb->posts.* FROM $wpdb->posts WHERE $wpdb->posts.post_status = 'publish' AND $wpdb->posts.post_type = 'post' ";
$pageposts = $wpdb->get_results($querystr, OBJECT);
  $counts = 0 ;
  if ($pageposts):
    foreach ($pageposts as $post):
      setup_postdata($post);
      $counts++;
      add_post_meta($post->ID, 'incr_number', $counts, true);
      update_post_meta($post->ID, 'incr_number', $counts);
    endforeach;
  endif;
}  

add_action ( 'publish_post', 'updateNumbers' );
add_action ( 'deleted_post', 'updateNumbers' );
add_action ( 'edit_post', 'updateNumbers' );

Once done, you can display the post nimber by pasting the following on your theme file, within the loop:

<?php echo get_post_meta($post->ID,'incr_number',true); ?> 

Credits goes to WordPress forums for this very cool piece of code!

Looking for WordPress hosting? Try WP Web Host. Prices starts at $5/month and you can try it for free!

How to display an incrementing number next to each published post

CodeIgniter from Scratch: Extending the Framework

CodeIgniter from Scratch: Extending the Framework

In today’s screencast we are going to learn how to create our own helpers and libraries. We are also going to learn how to extend the existing helpers and libraries that come with CodeIgniter. At the end of the tutorial we will extend the Form Validation library to give it the ability to check for password strength.


Catch Up


Day 13: Extending the Framework


Quick Tip: An Introduction to jQuery Templating

Quick Tip: An Introduction to jQuery Templating

JavaScript Templating is a neat idea: it allows you to easily convert JSON to HTML without having to parse it. At Microsoft’s MIX10 conference, they announced that they are starting to contribute to the jQuery team. One of their efforts is to provide a templating plugin. In this quick tip, I’ll show you how to use it!

You’ll need the data to template; you’ll likely retrieve JSON from your server; of course, Object / Array literals work just as well, so that’s what we use:

var data = [
		{ name : "John",  age : 25 },
		{ name : "Jane",  age : 49 },
		{ name : "Jim",   age : 31 },
		{ name : "Julie", age : 39 },
		{ name : "Joe",   age : 19 },
		{ name : "Jack",  age : 48 }
	];

The template is written in <script type="text/html"></script> tags; for each item in your JSON, the template will render the HTML; then, it will return the entire HTML fragment to you. We can get to the JavaScript values from within the template by using {% and %} as tags. We can also execute regular JavaScript within these tags. Here’s our template:

<li>
	<span>{%= $i + 1 %}</span>
	<p><strong>Name: </strong> {%= name %}</p>
	{% if ($context.options.showAge) {  %}
		<p><strong>Age: </strong> {%= age %}</p>
	{% } %}
</li>

To render the data with the template, call the plugin; pass the data to the plugin method; you can optionally pass in an options object as well. (These aren’t predefined options; they’re values you want to use within the template, perhaps for branching.)

$("#listTemplate").render(data, { showAge : true }).appendTo("ul");

It’s that easy! Have fun with it! You can get the complete code for this quick tip on Github