This plugin provide you with a perfect way to visualize all kinds of different data on your website. From simple line charts to complex combo charts, the plugin provides a large number of well-designed chart types all from the Google Chart Tools API .
Whether you choose to populate your data manually in the wp-admin or using the dynamic data option you will be able to create amazing looking charts in no time. We have also created additional add-ons, which will give you even more options.
Get Started
- Go to the “EVT Settings” menu in wp-admin and then click “Add new tools”
- Enter a title and choose how you want to add your data: manually, data file from media library or data from a URL .
- Choose your type of Chart and start configuring the settings. When you are done tweaking the different options, then click “Publish”
- Now you are ready to insert your new “Chart Tool”. Click on the “V” icon above the visual editor and then choose the “Chart Tool” you want to insert from the drop down menu.
Chart Library
Charts are exposed as JavaScript classes. Google Chart Tools provides many chart types for you to use. Even though we have provided you with a default appearance, which is best for most situations, you can easily customize a chart to fit the look and feel of your website. We have provided you with an extensive amount of features to customize, but we have tried our best to keep it user friendly.
Charts are highly interactive and expose events that enable you to connect them to create complex dashboards or other experiences integraed with your website. Charts are rendered using HTML5 /SVG technology to provide cross-browser compatibility (including VML for older versions of Internet Explorer and cross platform portability to iPhones, iPads and Android. No need for installing plugins.
Take a peek on how Easy Visualization Tools looks live and try for your self how easy it is to visualize your data. Simply use the following details to login.
Username: DemoUser
Password: TryMeNow

List of features
- 13 different Chart Types
- Available add-ons: Flip Numbers and Google Maps
- Fully Customizable
- HTML5 /SVG
- Cross Browser compatibility (including iPhone, iPad and Android)
- Real Time live preview of Charts in wp-admin when creating them
- Extensive help with tooltips build in
- Support for Manual Data
- Support for data file from Media Library
- Support for external data file
- Sample file for external data file included
- Responsive and user friendly interface in wp-admin
- Easy insert tool using the WordPress interface
Chart Types
- Area Charts
- Annotated Time Line Charts
- Bar Charts
- Column Charts
- Combo Charts
- Gauge Charts
- Geo Charts
- Intensity Maps
- Pie Charts (Manual Data)
- Pie Charts (Dynamic Data)
- Real Maps
- Scatter Charts
- Line Charts
- Table Charts
- Google Maps (add-on)
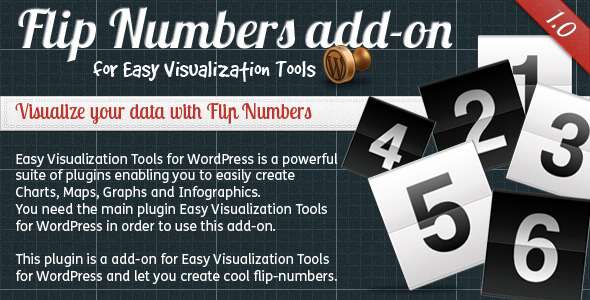
- Flip Numbers (add-on)
Support and Updates
We support our plugins and have a professional support ticket system setup to handle and track all issues or requests from our customers. Follow us on Envato or Twitter to stay up to date with new releases and updates.


Changelog
Version 1.0.0 rev23182 – March 25, 2012
* First release
Add-ons for Easy Visualization Tools
We have created a number of add-ons for Easy Visualization Tools, which will add additional amazing features to Easy Visualization Tools. Take a look at what is available below.